Blog Categories
5 Tips for Robust and Reproducible scRNA-Seq Data Analysis
Single-cell RNA sequencing (scRNA-seq) data analysis is a complex task that requires advanced computational tools to handle the high-dimensional nature of the data and extract meaningful insights.
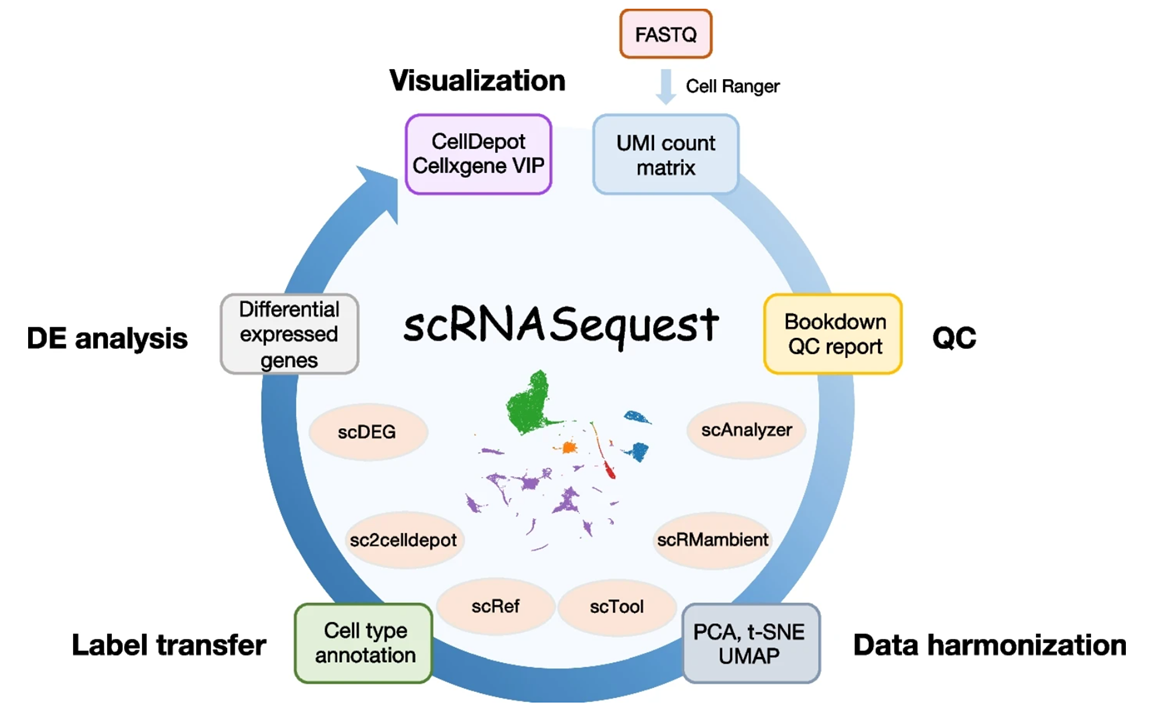
To address this challenge, BioInfoRx and Biogen have developed scRNASequest, an open-source ecosystem for scRNA-seq analysis, visualization, and publishing. The open-source pipeline has gained significant traction in pharmaceutical R&D settings and has been fine-tuned through extensive experience with numerous single-cell data sets, ensuring its reliability and effectiveness. To make this powerful pipeline more accessible, our team has introduced a fully supported and user-friendly version in BxGenomics, enabling academic and small biotech researchers to leverage its capabilities without the need for extensive IT and bioinformatics expertise.
Here we share some tips we learned from developing and running the pipeline on hundreds of scRNA-Seq experiments.
If you like in-person discussions, please meet with us at ASHG2023 in Washington DC from November 1 to 5, 2023.
Tip #1: Build scalable and reliable IT infrastructure and a reproducible computational environment
The high dimensional data from scRNA-Seq requires powerful computers and It is critical to control the software versions in the pipeline to ensure reproducibility. This applies to those who want to build the whole ecosystem for scRNA-Seq analysis (e.g. using our published codes on GitHub).
The complete ecosystem typically comprises three servers: a main web server for user login and scRNA data set browsing, a data processing server (HPC or cloud computing) for analysis (GPU recommended for ambient RNA removal with CellBender), and a dedicated server hosting cellxgene VIP for h5ad data visualization.
In our case, the pipeline combines Python and R to create an automatic workflow, leveraging state-of-the-art methods like Seurat and Scanpy to handle large data sets. We ensure consistent software versions and dependencies across different machines using conda, and also offer containerized installation through Docker.
Alternatively, researchers can leverage read-to-use cloud-based systems like BxGenomics for single-cell analysis without worrying about IT and software complexities.
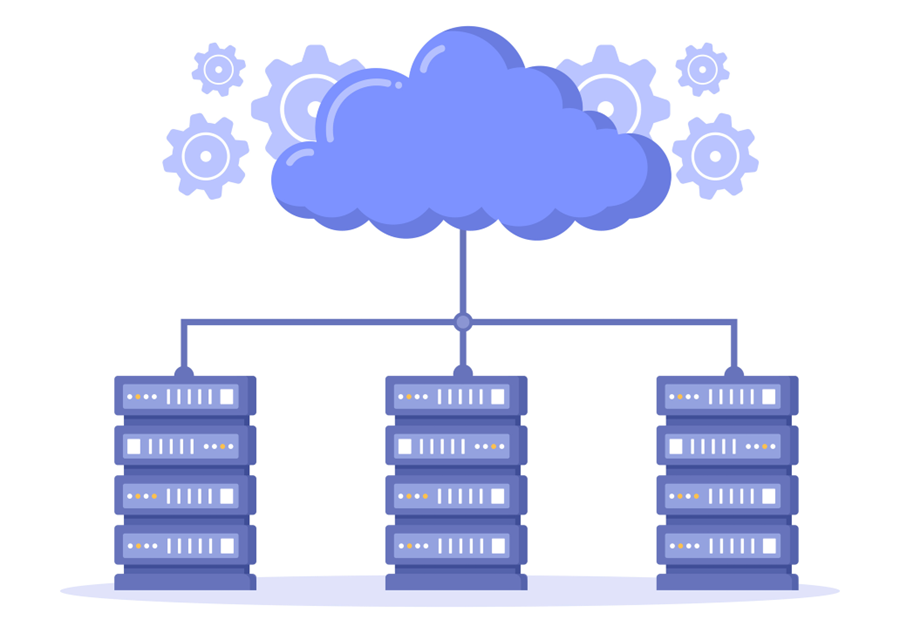
Utilizing multiple servers makes the system more reliable and scalable.
Tip #2: Perform comprehensive quality control and deliver user-friendly QC report
Single-cell experiments are complex and require careful quality assessment to filter out low-quality cells and genes. Quality control (QC) of single-cell data is crucial for preventing “garbage-in garbage-out” situations. In addition to comprehensive QC, presenting QC results in easy-to-use graphic formats is also important. This enables analysts to make informed decisions and try different filtering options quickly.
Therefore, it is a good idea to include comprehensive QC steps in scRNA pipelines. In the case of scRNASequest / BxGenomics, the workflow generates multiple plots to aid the QC assessment, including the number of genes detected, total UMI counts, and percentage of mitochondrial and ribosomal reads at a single-cell level. The Cell Ranger-generated sequencing metrics are also used to generate summary figures. Users can set filter parameters based on the summary plots to remove low-quality data. All the QC summary plots (both pre- and post-filtering) are available as a PDF file and as an HTML bookdown report.
(See an example QC bookdown report here.)
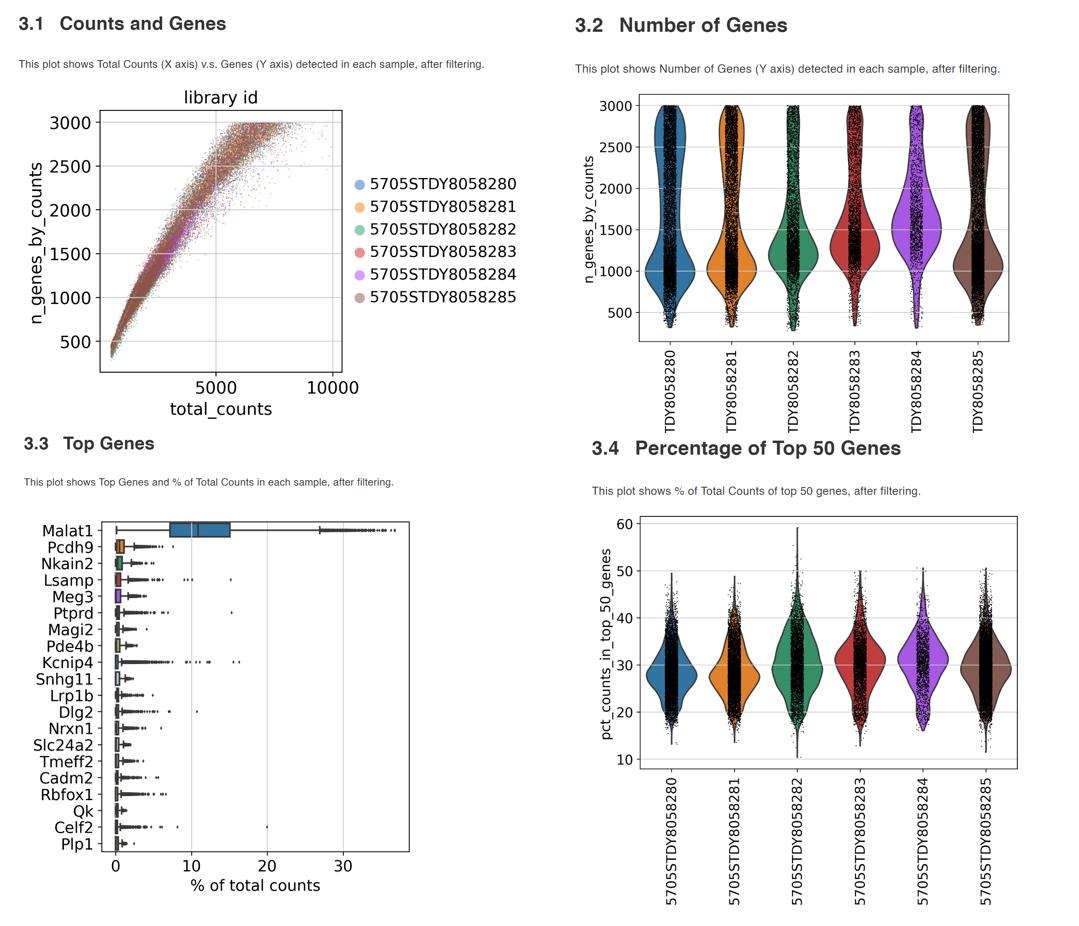
Examples of QC plots from the bookdown report.
In addition to standard QC, it is beneficial to incorporate advanced methods to further clean up the data. For example, scDBLFinder can detect doublets (a droplet containing two cells) and remove them. When the samples have high contaminating background counts (seen more often in single-nuclei samples), users can perform ambient RNA removal using CellBender, a new method that outperforms other tools.
To integrate CellBender, our pipeline creates barcode rank plots for all samples in a single file to streamline setting up CellBender parameters. The CellBender jobs are submitted to GPU to increase the speed. In our tests, running CellBender on a typical sample takes about 1hr with GPU, but over 10 hours with CPU.
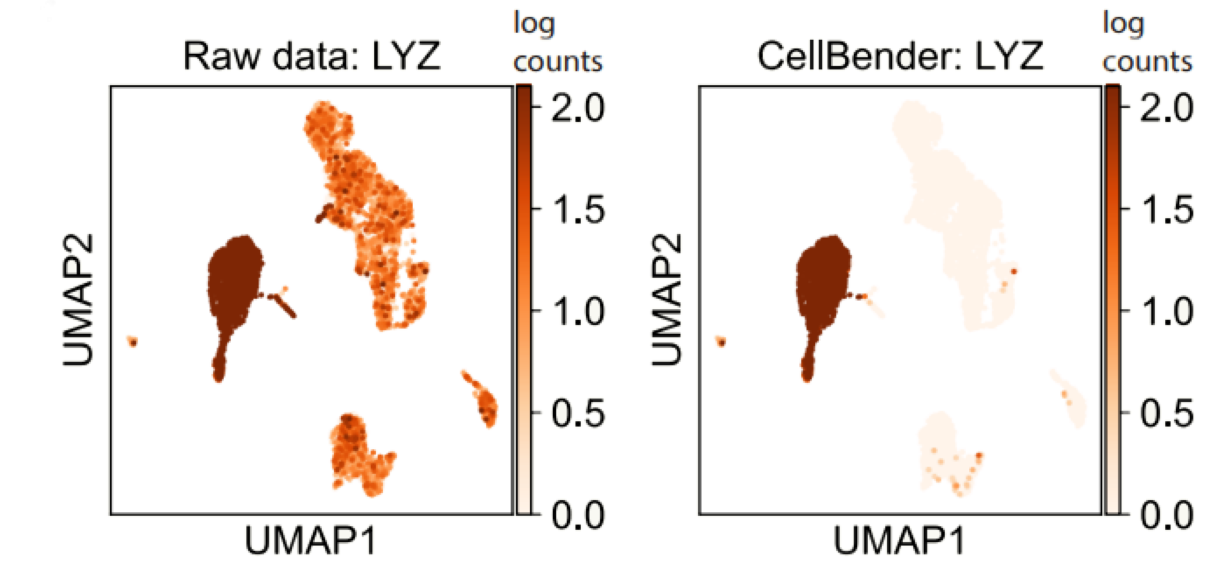
CellBender removes background RNA, and significantly increases the specificity of monocyte marker LYZ.
Tip #3: Remove batch effect by harmonizing different samples
Batch effects are often seen in single-cell data, and it is critical to perform data harmonization when working with multiple samples/experiments and identify biological differences instead of technical ones. Multiple harmonization methods are available, and different projects may benefit from different methods.
To achieve this, you need a pipeline that incorporates multiple harmonization methods to integrate different datasets. scRNASequest employs state-of-the-art methods such as Seurat RPCA, Harmony, and LIGER. By taking count matrices from different samples or batches, we create an integrated data object that facilitates meaningful analysis. Additionally, we utilize the kBET and silhouette metrics to evaluate the performance of different harmonization methods. Users can review the output from different methods and choose the one that best fits their projects.
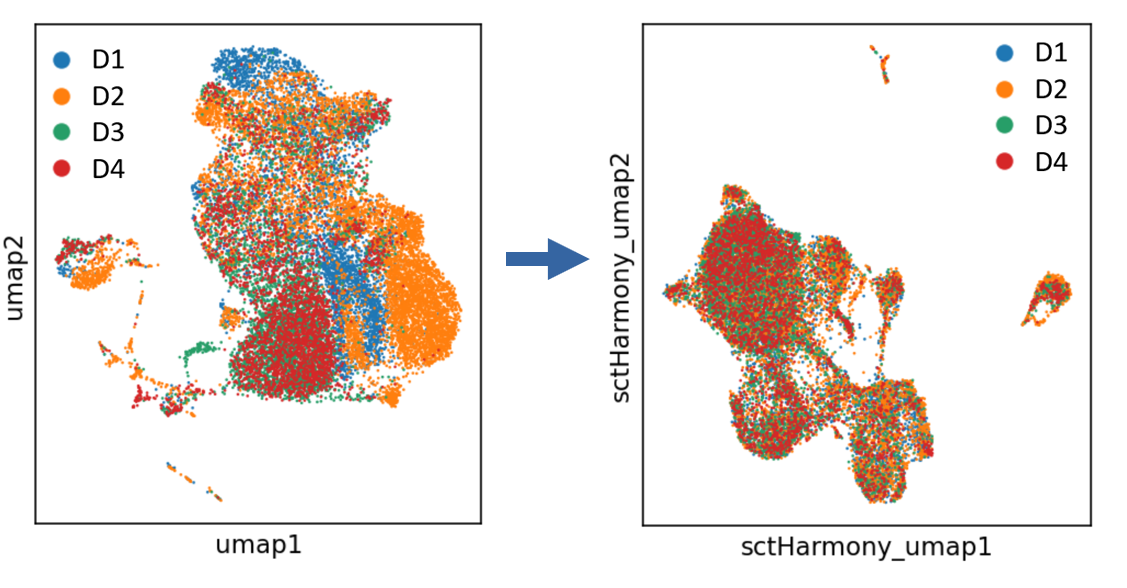
The four samples from an experiment show batch effects, after processing by Harmony, the batch effects are gone and the four samples are mixed evenly on UMAP projection.
Tip #4: Use benchmarking studies to select tools for extracting biological insights
Ultimately, the results of single-cell analysis should provide answers to important biological questions. To achieve this, we recommend deploying reproducible methods whenever possible. It is also essential to carefully select the methods to include in the workflow based on benchmarking studies and user feedback.
A key step in interpreting scRNA-seq results is to assign cell types. Automated cell type label transfer using reference data sets is quick and reproducible. In our workflow, we employ the Seurat reference-based label transfer method and include commonly used references. We also developed scRef in the pipeline, a tool that converts previously analyzed datasets to reference data, ensuring flexibility and reproducibility in cell type annotation. For datasets without suitable references, manual annotation or alternative methods are required. We are actively expanding our references and implementing additional methods to enhance the robustness and automation of cell annotation. BxGenomics users receive expert support for cell type annotation and verification.
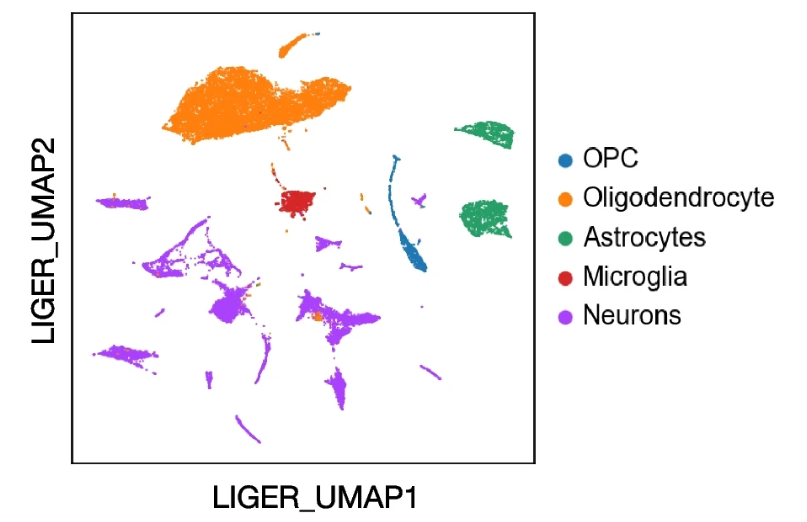
A mouse brain sample annotated using reference-based cell type transfer.
Differential expression (DE) analysis is crucial for identifying gene expression changes between different conditions. Based on recent benchmarking analysis, NEBULA has emerged as an ideal DE analysis method. Our pipeline incorporates NEBULA as the default method for DE analysis and offers other options such as glmmTMB and MAST. The DE results can be further analyzed using the fgsea package for gene set enrichment analysis (GSEA), providing valuable insights into known pathways and ontologies.
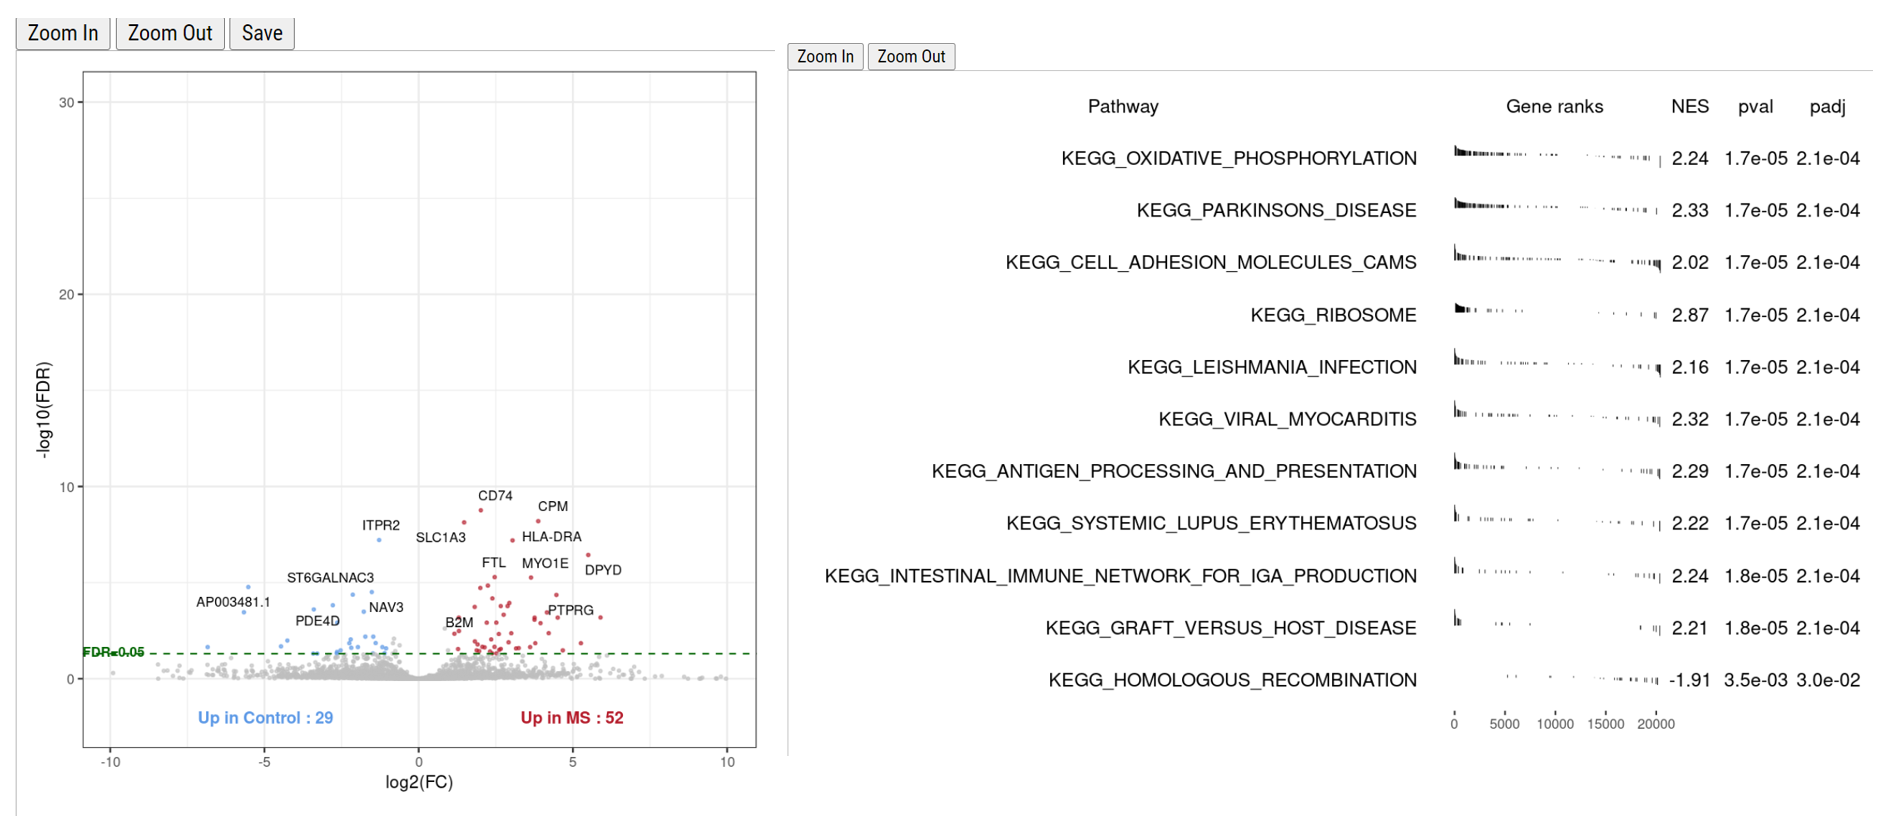
DE analysis of MS vs. Control in microglia using the cellxgene VIP platform. Left, volcano plot; right, GSEA results.
Tip #5: Provide standardized output and interactive data visualization
Standard output format simplifies sharing, collaboration, data management and storage, and enables long-term accessibility and reusability of single-cell data. A companion graphic platform that allows non-programmers to load the output files, visualize the data, and perform integrative analysis will further accelerate scientific discovery.
Currently the leading output formats for scRNA-Seq are h5ad (for Python) and Seurat format (for R). In our case, the pipeline generates python-friendly h5ad files to store the final results, as well as h5seurat files for R interface. The h5ad files can be easily visualized through the cellxgene VIP platform developed by our team.
Cellxgene VIP is a plug-in tool that enhances the cellxgene single-cell visualization platform. It offers an expanded array of features, including violin plots, volcano plots, dot plots, heatmaps, and complex figures, providing a comprehensive solution for exploring processed single-cell datasets.
To learn more, please check the cellxgene VIP demo data or watch a tutorial video.
Our team supports the single-cell community that uses cellxgene VIP and frequently improves this tool. Advanced users can install this powerful visualization tool following our instructions at GitHub. BxGenomics users can launch their data sets directly using cellxgene VIP hosted on our servers.
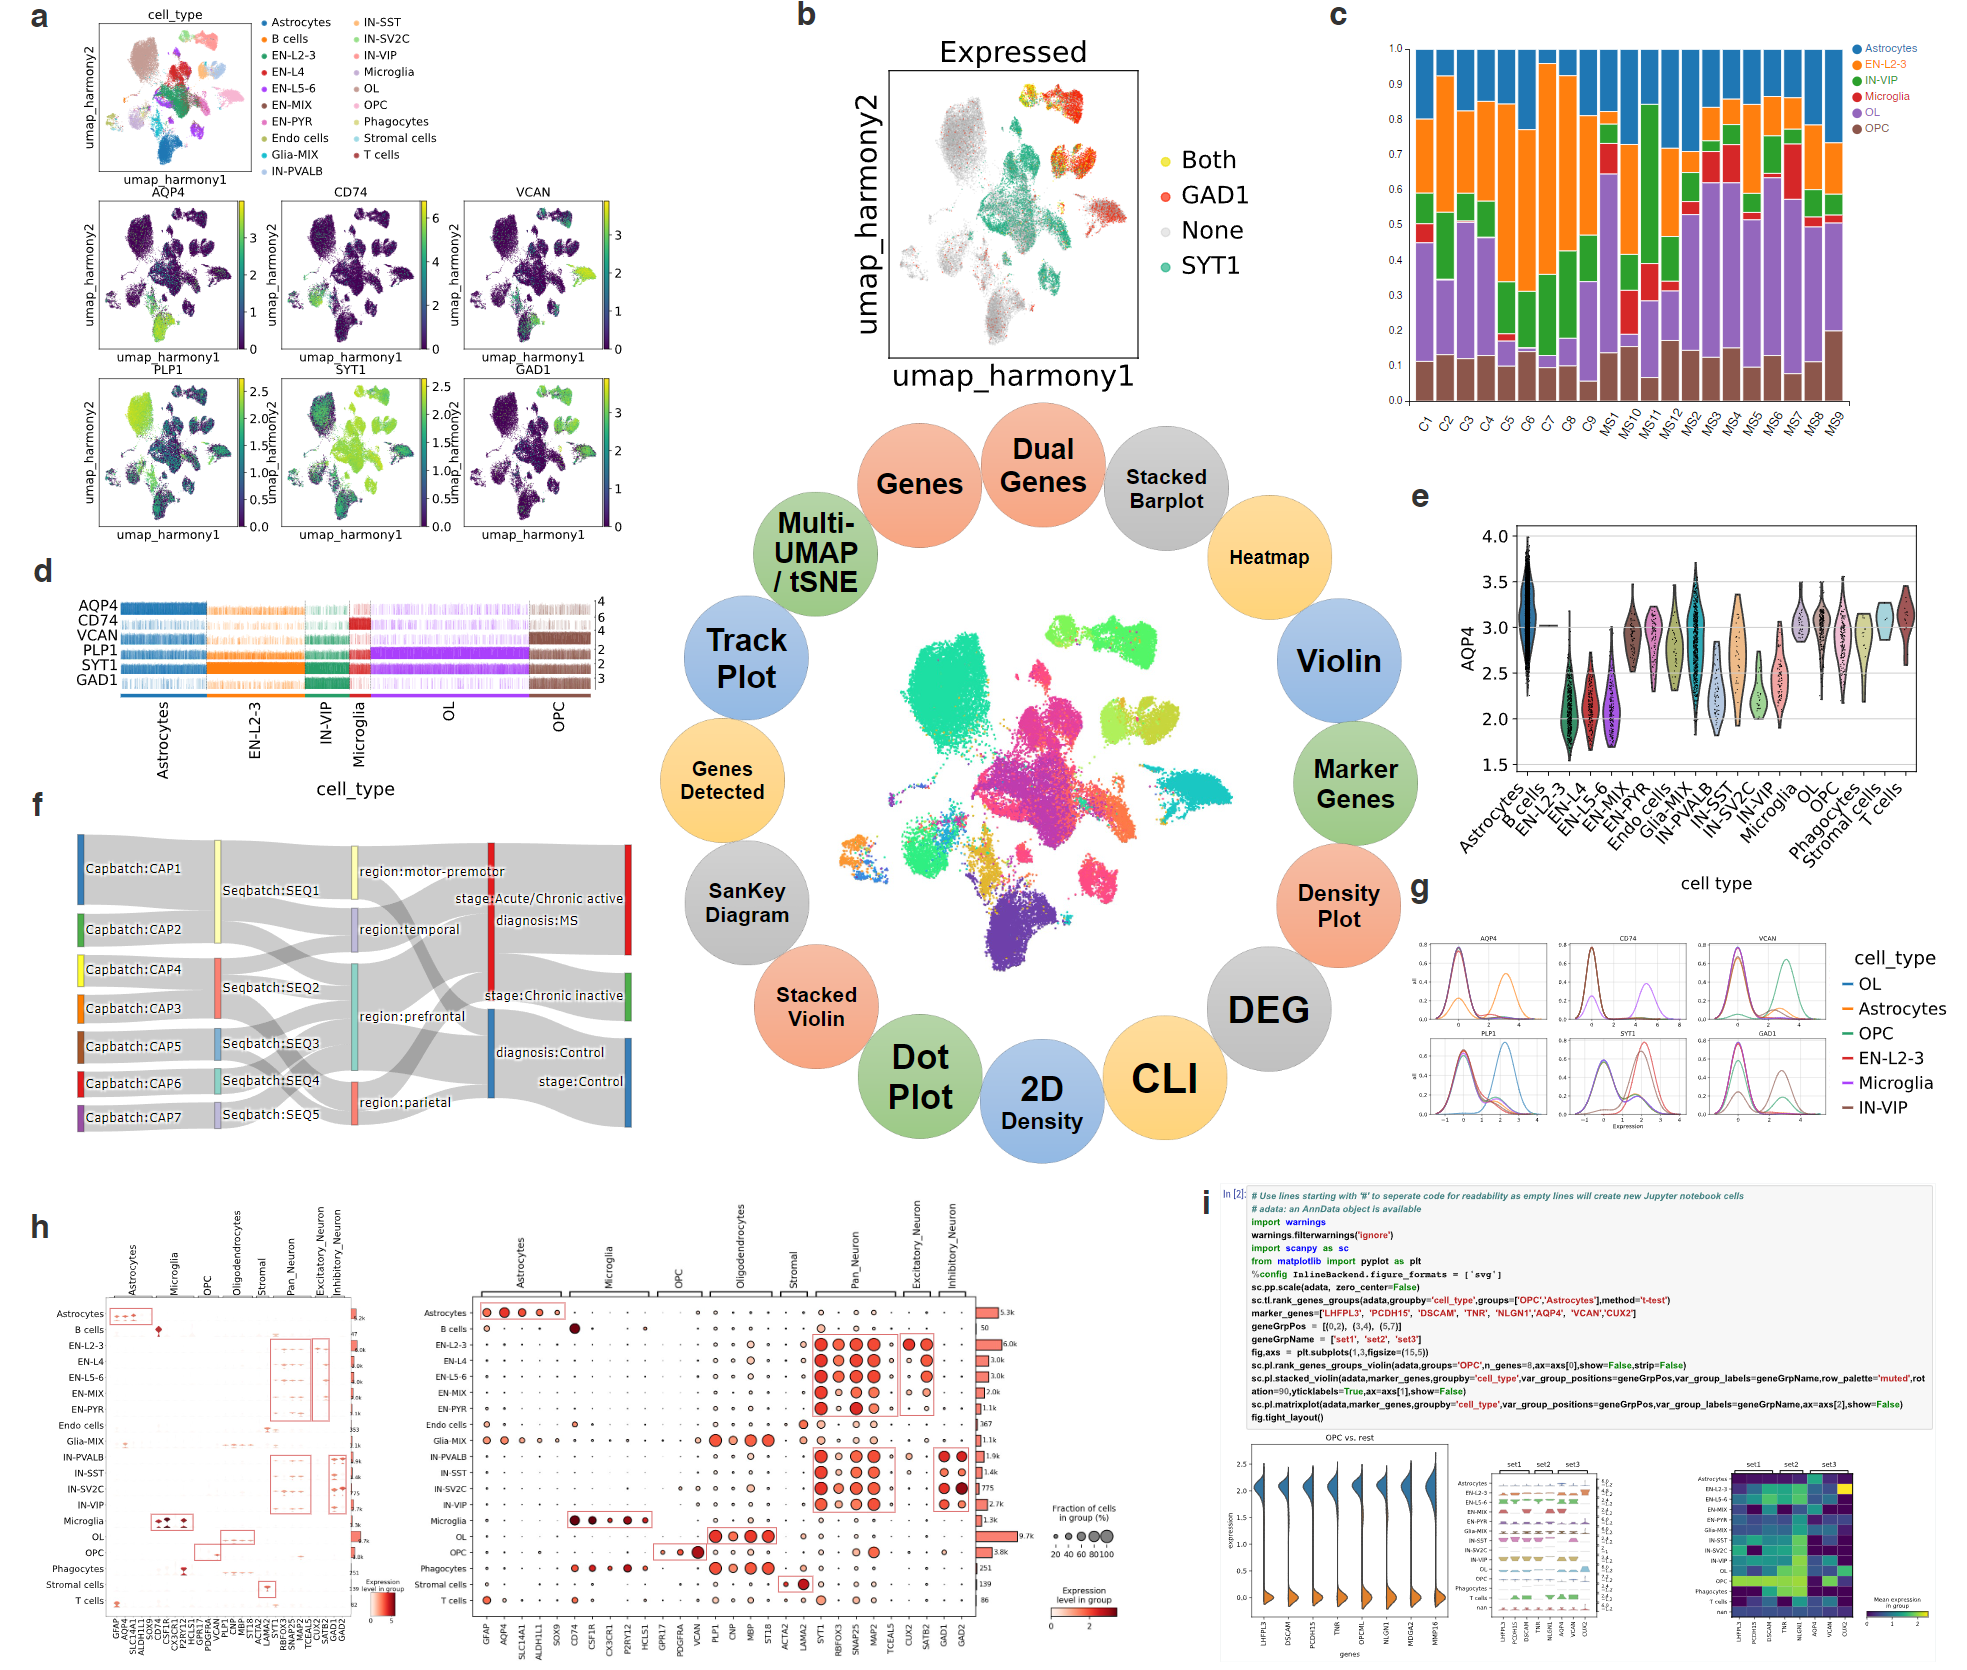
Cellxgene VIP provides more than 20 analytical modules for scRNA data.
How to access the scRNASequest pipeline?
We hope the 5 tips above can help you get better and more consistent results from your scRNA-Seq data analysis. These tips are based on our experience developing the open-source scRNASequest pipeline and implementing the ready-to-use and fully supported BxGenomics system.
Experienced users can install the scRNASequest pipeline by following our detailed instructions on GitHub. For any questions or issues, you can report them on GitHub, and our team actively monitors the platform. If you require commercial support for the pipeline, please contact us directly.
For users looking for ready-to-use solutions, the BxGenomics scRNA View system offers a fast, convenient and reliable solution. It works for both small and large projects and is fully supported. Our expert team will assist you with quality control, cell annotation, differential expression analysis, and functional analysis. Users have their own secure accounts to visualize and analyze their data using cellxgene VIP hosted by us. You are welcome to register a free account and explore over 400 public datasets. When you are ready to analyze your own data, please contact our team to start your first custom project.
Meet with our scRNA-Seq Experts at ASHG2023
Launch BxGenomics Apps
Request (sc)RNA-Seq Analysis
Schedule Demo for Data Mining Platform