Blog Categories
Expanding Horizons: BxGenomics Adds NanoString CosMx Data Analysis to scRNA-Seq View
In a significant advancement for single-cell and spatial transcriptomics, BxGenomics, an integrated online genomics data analysis system developed by BioInfoRx, has expanded its capabilities by incorporating NanoString CosMx Spatial Molecular Imaging (SMI) data analysis into its scRNA-Seq View application. This integration marks a pivotal step toward providing researchers with a more comprehensive and streamlined web-based platform for analyzing high-dimensional single-cell spatial transcriptomics data.
NanoString CosMx SMI is a state-of-the-art platform that enables highly multiplexed spatial gene expression analysis at single-cell and subcellular resolution. By capturing molecular profiles within their native tissue context, CosMx SMI empowers researchers to explore cellular interactions, disease microenvironments, and tissue architecture in unprecedented detail.
Researchers at BioInfoRx have developed a spatial transcriptomics analysis pipeline for CosMx SMI dataset, consisting of four main steps: data extraction, processing, visualization, and validation. It extracts key features such as gene expression, metadata, UMAP embeddings, and transcript locations for each Field of View (FOV). In spatial transcriptomics, FOV refers to the area of tissue or sample that is analyzed and mapped for gene expression, essentially the region of interest being examined. Additionally, it extracts cell boundary polygons and saves the x, y coordinates of cell outlines for visualization. The extracted datasets are processed and stored in an AnnData (.h5ad) object, which is optimized for single-cell and spatial analysis. To ensure data accuracy, visualization and validation steps are performed. These steps help verify the correct alignment of cell boundaries, transcripts, and spatial features.
Using CosMx SMI human liver FFPE dataset from Nanostring as an example, BxGenomics demonstrates the capabilities of its new application. A subset of the dataset was selected, processed and visualized in Cellxgene VIP (Li et al.,2022), as shown in Fig. 1. The base image is the CellComposite image provided by Nanostring, with the color channels for the segmentation markers displayed in the upper right corner of the figure.
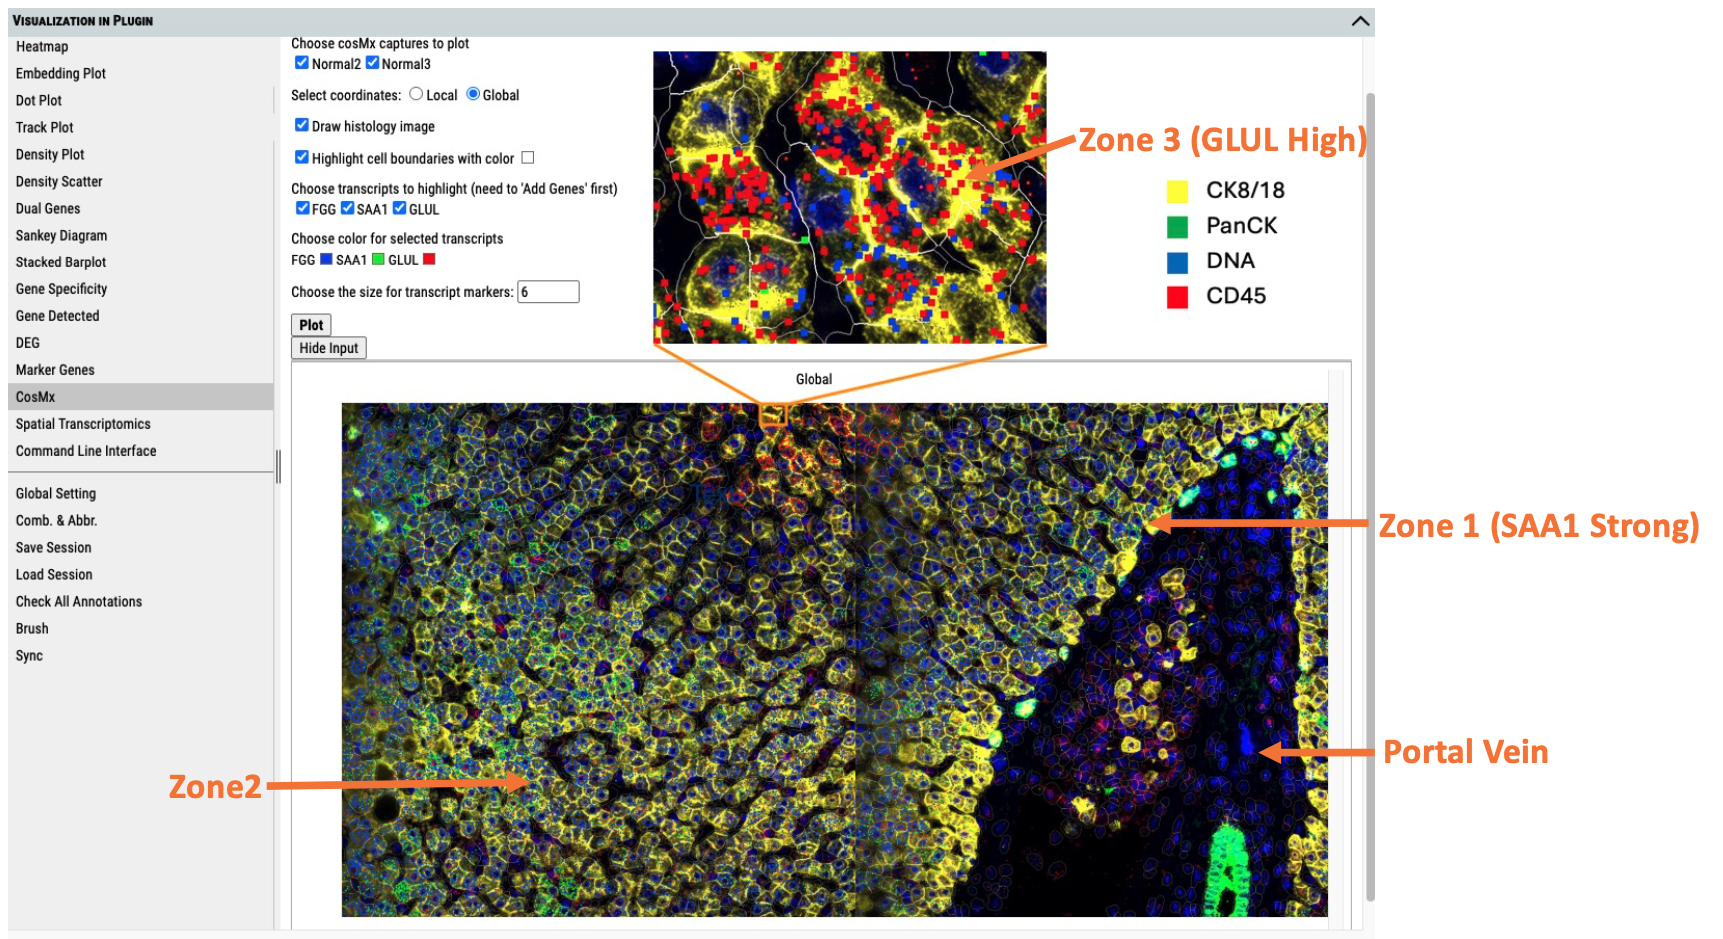
Figure 1. A subset of human liver FFPE dataset provided by Nanostring is shown in Cellxgene VIP.
The liver is the largest internal organ and plays a central role in nutrient metabolism and detoxification. Structurally, it is composed of liver lobules—hexagonal units organized around the portal triad and central vein. Within each lobule, hepatocytes are arranged into three distinct zones along the portal–central vein axis, a phenomenon referred to as liver zonation. Zone 1, the periportal region, is involved in metabolic functions and specialized in gluconeogenesis. Zone 3, surrounding the central vein (less oxygen) is involved in bile acid production drug metabolism and glycolysis. Zone 2, the midlobular area, represents a transitional zone with intermediate exposure to oxygen and metabolites.
The spatial heterogeneity of hepatocytes is reflected in their distinct gene expression profiles (Puri, 2024). In this context, the use of three zonation markers—FGG, SAA1, and GLUL—is particularly effective for identifying liver zonation in normal tissue. SAA1 and FGG are predominantly expressed in periportal hepatocytes (Zone 2), whereas GLUL is specifically enriched in pericentral hepatocytes (Zone 3). Visualization of these markers enables precise identification of the functional zones and provides a robust framework for studying liver architecture and physiology.
In Fig. 1, the GLUL gene is indicated by a red square, SAA1 by green, and FGG by blue. In the enlarged CellComposite image, GLUL is highly expressed, indicating that this area corresponds to Zone 3. In the original image, the region surrounding the orange-highlighted rectangle shows widespread GLUL expression, confirming its pericentral identity. In the lower right portion of the figure, a longitudinal section of a portal vein is visible, appearing in dark blue and black. The region surrounding this structure, marked by strong SAA1 expression, corresponds to Zone 1. Between Zone 1 and Zone 3, areas enriched in both FGG and SAA1 expression (marked by blue and green squares, respectively) likely represent Zone 2.
To further explore and interpret these spatial expression patterns, users can leverage the full suite of analytical tools available in Cellxgene VIP. All the features and functions previously developed for Cellxgene VIP are still valid, such as multi-tSNE/UMAP plots, dual-gene plots, stacked bar plots, track plots, violin plots, dot plots, etc. These functions can help users perform in-depth analysis of spatial transcriptomics datasets. Additionally, users can select a preferred base image to better suit their research needs.
The integration of CosMx SMI into BxGenomics opens new avenues for spatial transcriptomics research, with potential applications in personalized medicine, drug discovery, and synthetic biology. As the technology continues to evolve, BioInfoRx is poised to drive further innovations in genomics, helping to shape the future of biology research.
References:
Li, K., Ouyang, Z., Chen, Y., Gagnon, J., Lin, D., Mingueneau, M., Chen, W., Sexton, D., & Zhang, B. (2022). Cellxgene VIP unleashes full power of interactive visualization and integrative analysis of scRNA-seq, spatial transcriptomics, and multiome data. bioRxiv. https://doi.org/10.1101/2020.08.28.270652
Puri M. Spatial computational hepatic molecular biomarker reveals LSEC role in midlobular liver zonation fibrosis in DILI and NASH liver injury. Int J Transl Med. 2024;4(2):12. https://www.mdpi.com/2673-8937/4/2/12