Blog Categories
Unlocking the Power of Multi-Omics Data with xOmicsShiny
In the age of high-throughput biological research, multi-omics integration is essential for unraveling complex biological processes. However, managing, analyzing, and extracting meaningful insights from vast and complex datasets remains a challenge. xOmicsShiny (Gao et al., 2025), developed by researchers from BioInfoRx and Biogen, provides a comprehensive platform for cross-omics data analysis. Unlike existing tools, xOmicsShiny offers an intuitive interface for seamless data merging and interactive visualization across transcriptomics, proteomics, metabolomics, and lipidomics datasets, allowing researchers to efficiently explore pathway-level insights. From the BioInfoRx team, Xinmin Zhang and Wei Li contributed to the development of xOmicsShiny, and we plan to bring some of the new features to BxGenomics to benefit more researchers.
Built using R Shiny, xOmicsShiny employs a modular design with 14 analytical modules, ensuring efficient data processing and scalability, as illustrated in Fig. 1. Users load only the necessary modules, minimizing computational overhead and optimizing performance. Following best practices in bioinformatics analysis, it incorporates widely recognized packages, including ComplexHeatmap (Gu, 2022; Gu et al., 2016), fgsea (Korotkevich et al., 2021), WGCNA (Langfelder and Horvath, 2008), PCSF (Akhmedov et al., 2017), pathview (Luo and Brouwer, 2013), among others.
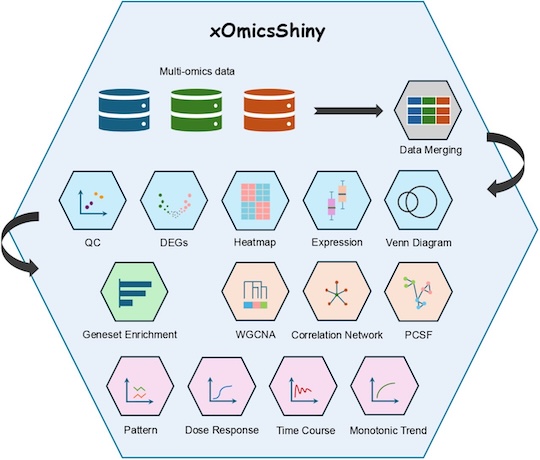
Figure 1. Overview of xOmicsShiny modules.
Merging data is a critical step in multi-omics analysis. xOmicsShiny automatically matches gene symbols and compound IDs, integrating differential expression results from multiple comparisons while preserving the original information. Additionally, it provides four methods for meta p-value calculation: Fisher, minP, Simes, and Stouffer. By default, the meta fold change is displayed as the average fold change, and users can customize the formula to summarize fold changes.
For pathway analysis and prioritization, both Gene Set Enrichment Analysis (GSEA) and Over-Representation Analysis (ORA) are used in the Geneset Enrichment module. The enrichment step is performed using the fgsea package, and the visualization is facilitated by the collapsePathways function. Currently, xOmicsShiny supports the WikiPathways, Reactome, KEGG, and MetaBase databases.
xOmicsShiny enables both single-omics and multi-omics enrichment analysis using the KEGG database and displays both genes and compounds on the KEGG pathway maps. To streamline this step, a metabolite database containing 263,000 unique metabolites from multiple sources was created. As shown in Fig. 2, genes and metabolites are mapped to KEGG pathway maps, where red and green indicate gene changes, and yellow and blue indicate metabolite changes. Besides enrichment analysis and pathway visualization, xOmicsShiny also supports Weighted Gene Co-expression Network Analysis (WGCNA), dose response and time course analysis.
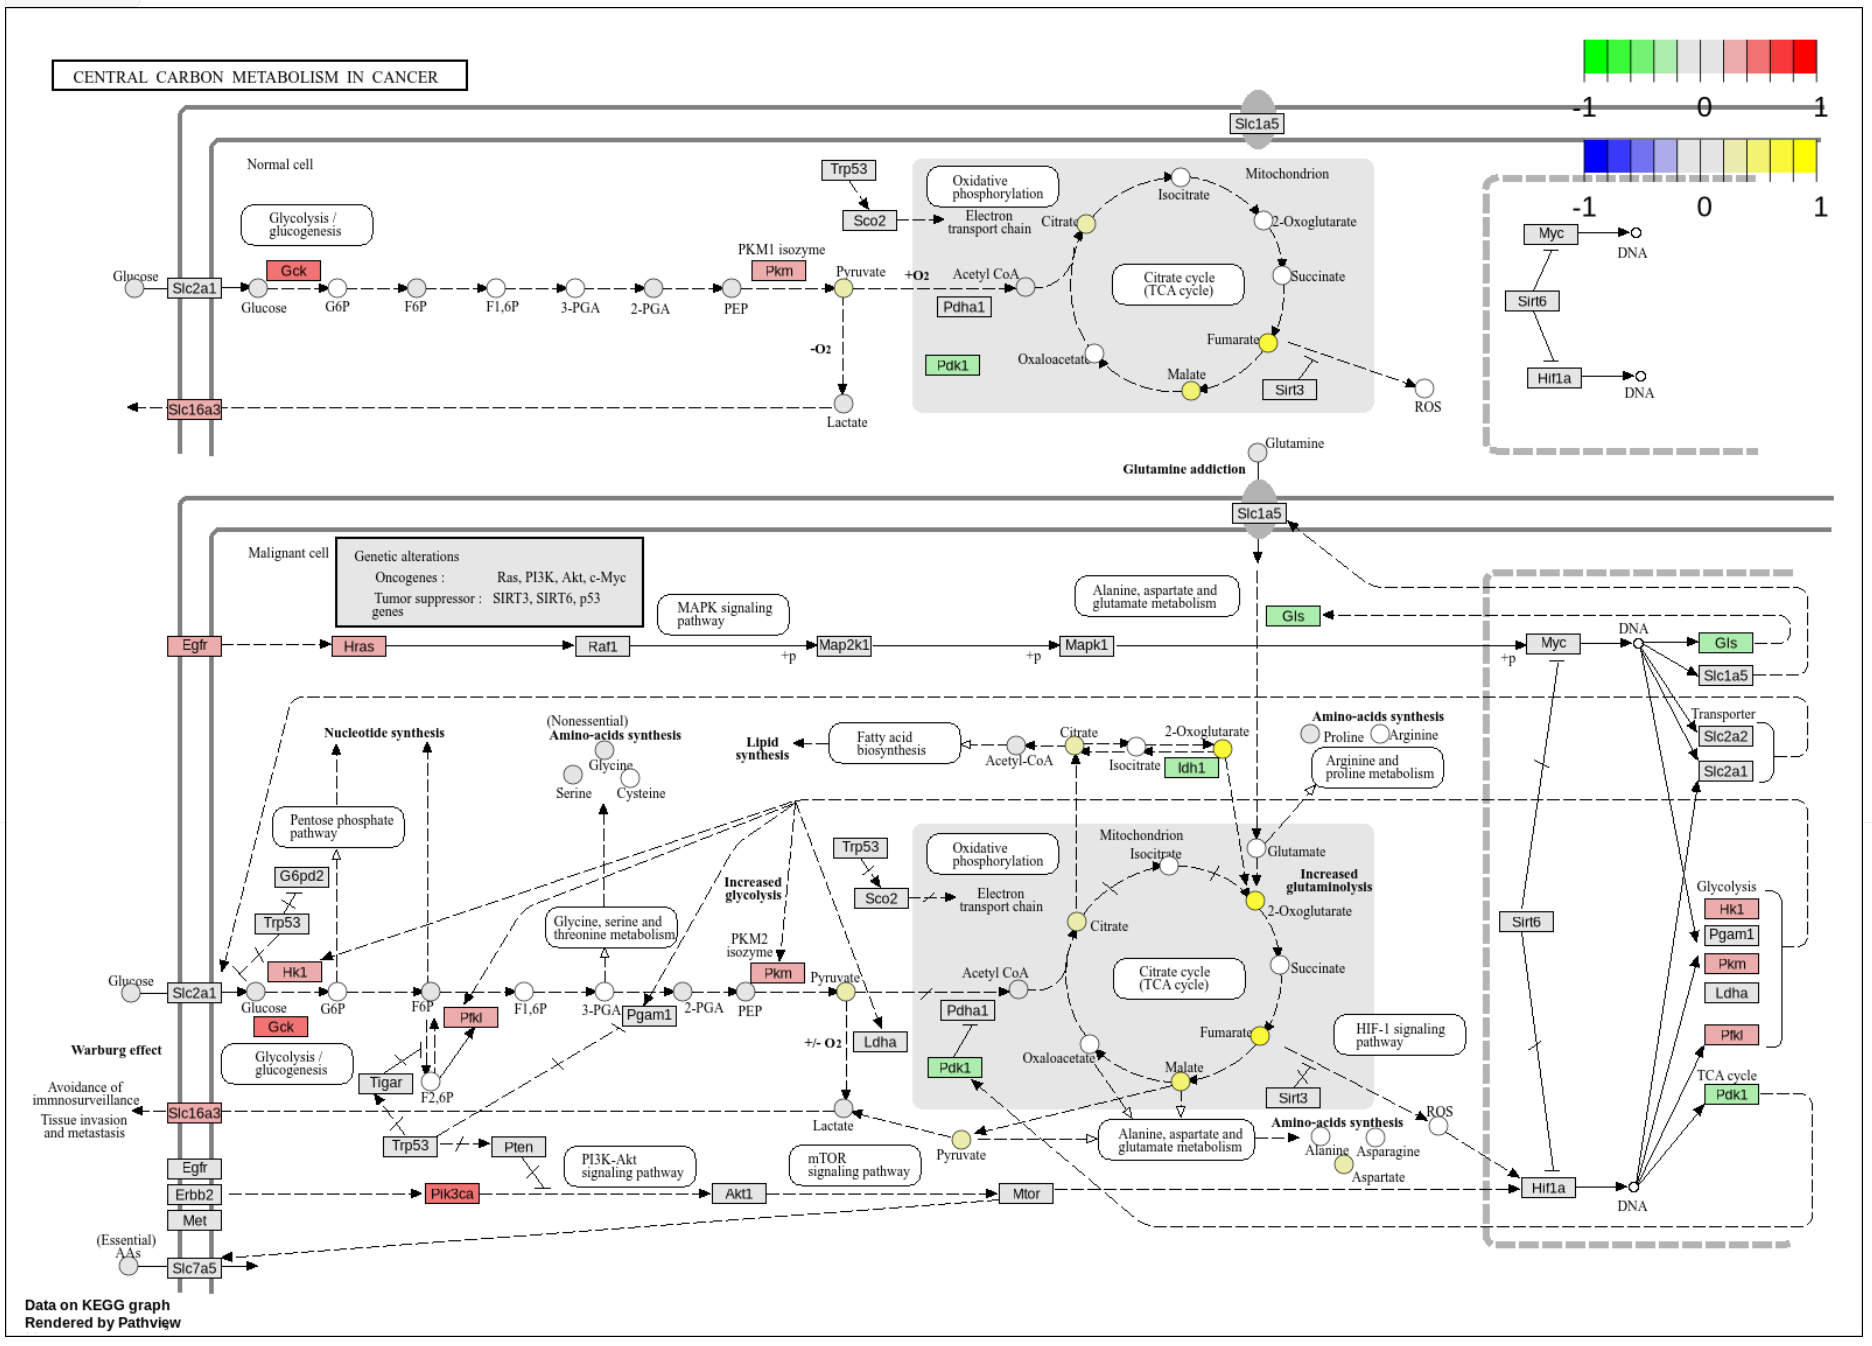
Figure 2. Pathway visualization by mapping genes and metabolites to KEGG pathway maps.
xOmicsShiny is designed with biologists in mind, offering an intuitive, easy-to-use interface that does not require extensive programming expertise. Researchers can start using xOmicsShiny in two ways:
- Public Server Access (Provided by BioinfoRx) – Run analysis directly at xOmicsShiny.bxgenomics.com using pre-loaded demo datasets or by uploading custom data (Fig. 3).
- Local Installation – The source code is available on GitHub (https://github.com/interactivereport/xOmicsShiny) under the GPLv3 license, allowing researchers to install, modify, and customize it as needed.

Figure 3. Online platform for xOmicsShiny, hosted by BioInfoRx.
xOmicsShiny stands out as a next-generation multi-omics analysis tool, combining flexibility, advanced visualization, and robust pathway mapping capabilities. Whether you're exploring transcriptomics, proteomics, metabolomics, or lipidomics data, xOmicsShiny provides the power and versatility needed to turn complex datasets into actionable biological insights.
Start your journey with xOmicsShiny today and unlock the full potential of your multi-omics data!
References:
1. Gao, B., Sun, Y. H., Zhang, X., Lin, T., Li, W., Admanit, R., & Zhang, B. (2025). xOmicsShiny: An R Shiny application for cross-omics data analysis and pathway mapping. bioRxiv. https://doi.org/10.1101/2025.01.30.635740
2. Gu, Z. (2022). Complex heatmap visualization. iMeta, 1(3), e43. https://doi.org/10.1002/imt2.43
3. Gu, Z., Eils, R., & Schlesner, M. (2016). Complex heatmaps reveal patterns and correlations in multidimensional genomic data. Bioinformatics, 32(18), 2847–2849. https://doi.org/10.1093/bioinformatics/btw313
4. Korotkevich, G., Sukhov, V., Budin, N., Shpak, B., Artyomov, M. N., & Sergushichev, A. (2021). Fast gene set enrichment analysis. bioRxiv. https://doi.org/10.1101/060012
5. Langfelder, P., & Horvath, S. (2008). WGCNA: An R package for weighted correlation network analysis. BMC Bioinformatics, 9, 559. https://doi.org/10.1186/1471-2105-9-559
6. Akhmedov, M., Kedaigle, A., Chong, R. E., Montemanni, R., Bertoni, F., Fraenkel, E., & Kwee, I. (2017). PCSF: An R-package for network-based interpretation of high-throughput data. PLoS Computational Biology, 13(7), e1005694. https://doi.org/10.1371/journal.pcbi.1005694
7. Luo, W., & Brouwer, C. (2013). Pathview: An R/Bioconductor package for pathway-based data integration and visualization. Bioinformatics, 29(14), 1830–1831. https://doi.org/10.1093/bioinformatics/btt285