Overview
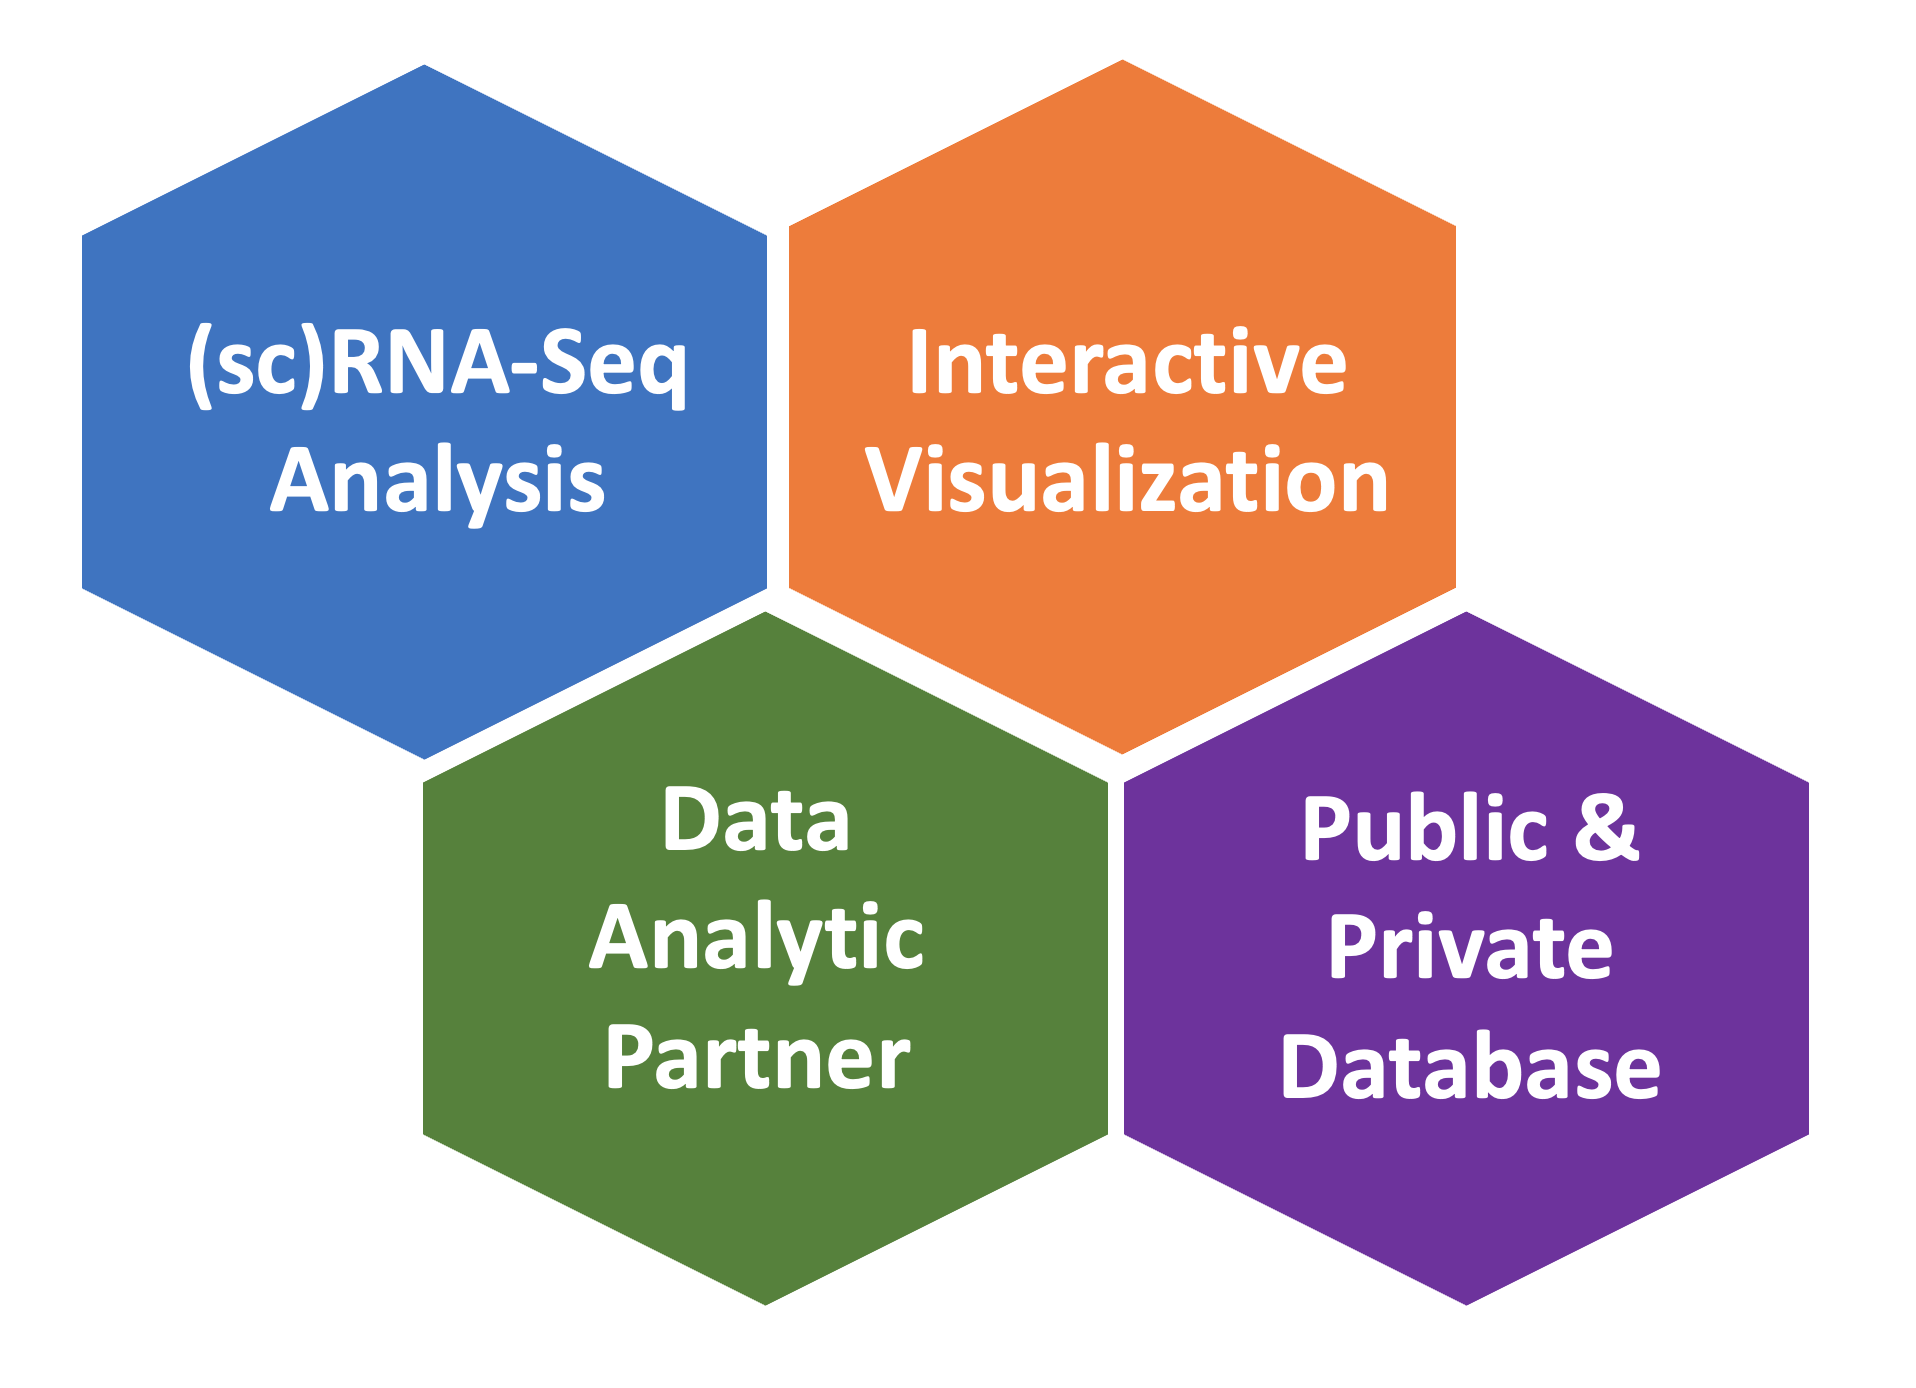
BxGenomics is a comprehensive platform that provides biologists with an efficient and user-friendly solution for the analysis and data visualization of single-cell and bulk RNA-Seq data. The integrated (sc)RNA-Seq data solution offered by BxGenomics comprises three crucial components:
To leverage the existing knowledge in the genomic field, BxGenomics Apps are preloaded with a vast repository of published data. This includes over 1,000 single-cell RNA-Seq data sets, encompassing more than 17 million cells, as well as over 30,000 bulk RNA-Seq projects containing over 1 million samples.
Single-Cell RNA-Seq Data Analysis and Mining Platform
BxGenomics scRNA-Seq View can be used for both private single-cell data and public datasets. Private data are analyzed by our best-practice pipeline. Public data are either provided by the authors or have been analyzed and curated using our pipeline.
The system has a strong scientific basis, with its core components published or submitted in peer-reviewed journals.
- Data analysis pipeline: scRNASequest: an ecosystem of scRNA-seq analysis, visualization and publishing. (BMC Genomics, 2023)
- Web portal for scRNA-Seq datasets: CellDepot: A Unified Repository for scRNA-seq Data and Visual Exploration. (Journal of Molecular Biology, 2022)
- Visualization Platform: Cellxgene VIP unleashes the full power of interactive visualization and integrative analysis of scRNA-seq, spatial transcriptomics, and multiome data. (Preprint • View Video Tutorial of cellxgene VIP)
BxGenomics uses the open-source solutions listed above but provides a fully supported and ready-to-use system with major enhancements, click here for details.
The single-cell RNA-Seq analysis pipeline integrates several popular tools (Seurat, Scanpy, Harmony, LIGER) and provides a semi-automated workflow for 1) processing of raw data, 2) batch-correction with several harmonization methods, 3) reference-based cell type label transfer, and 4) multi-sample multi-condition single-cell level differential gene expression analysis. The results can be directly loaded into the BxGenomics scRNA-Seq web databases and downstream analysis and visualization.
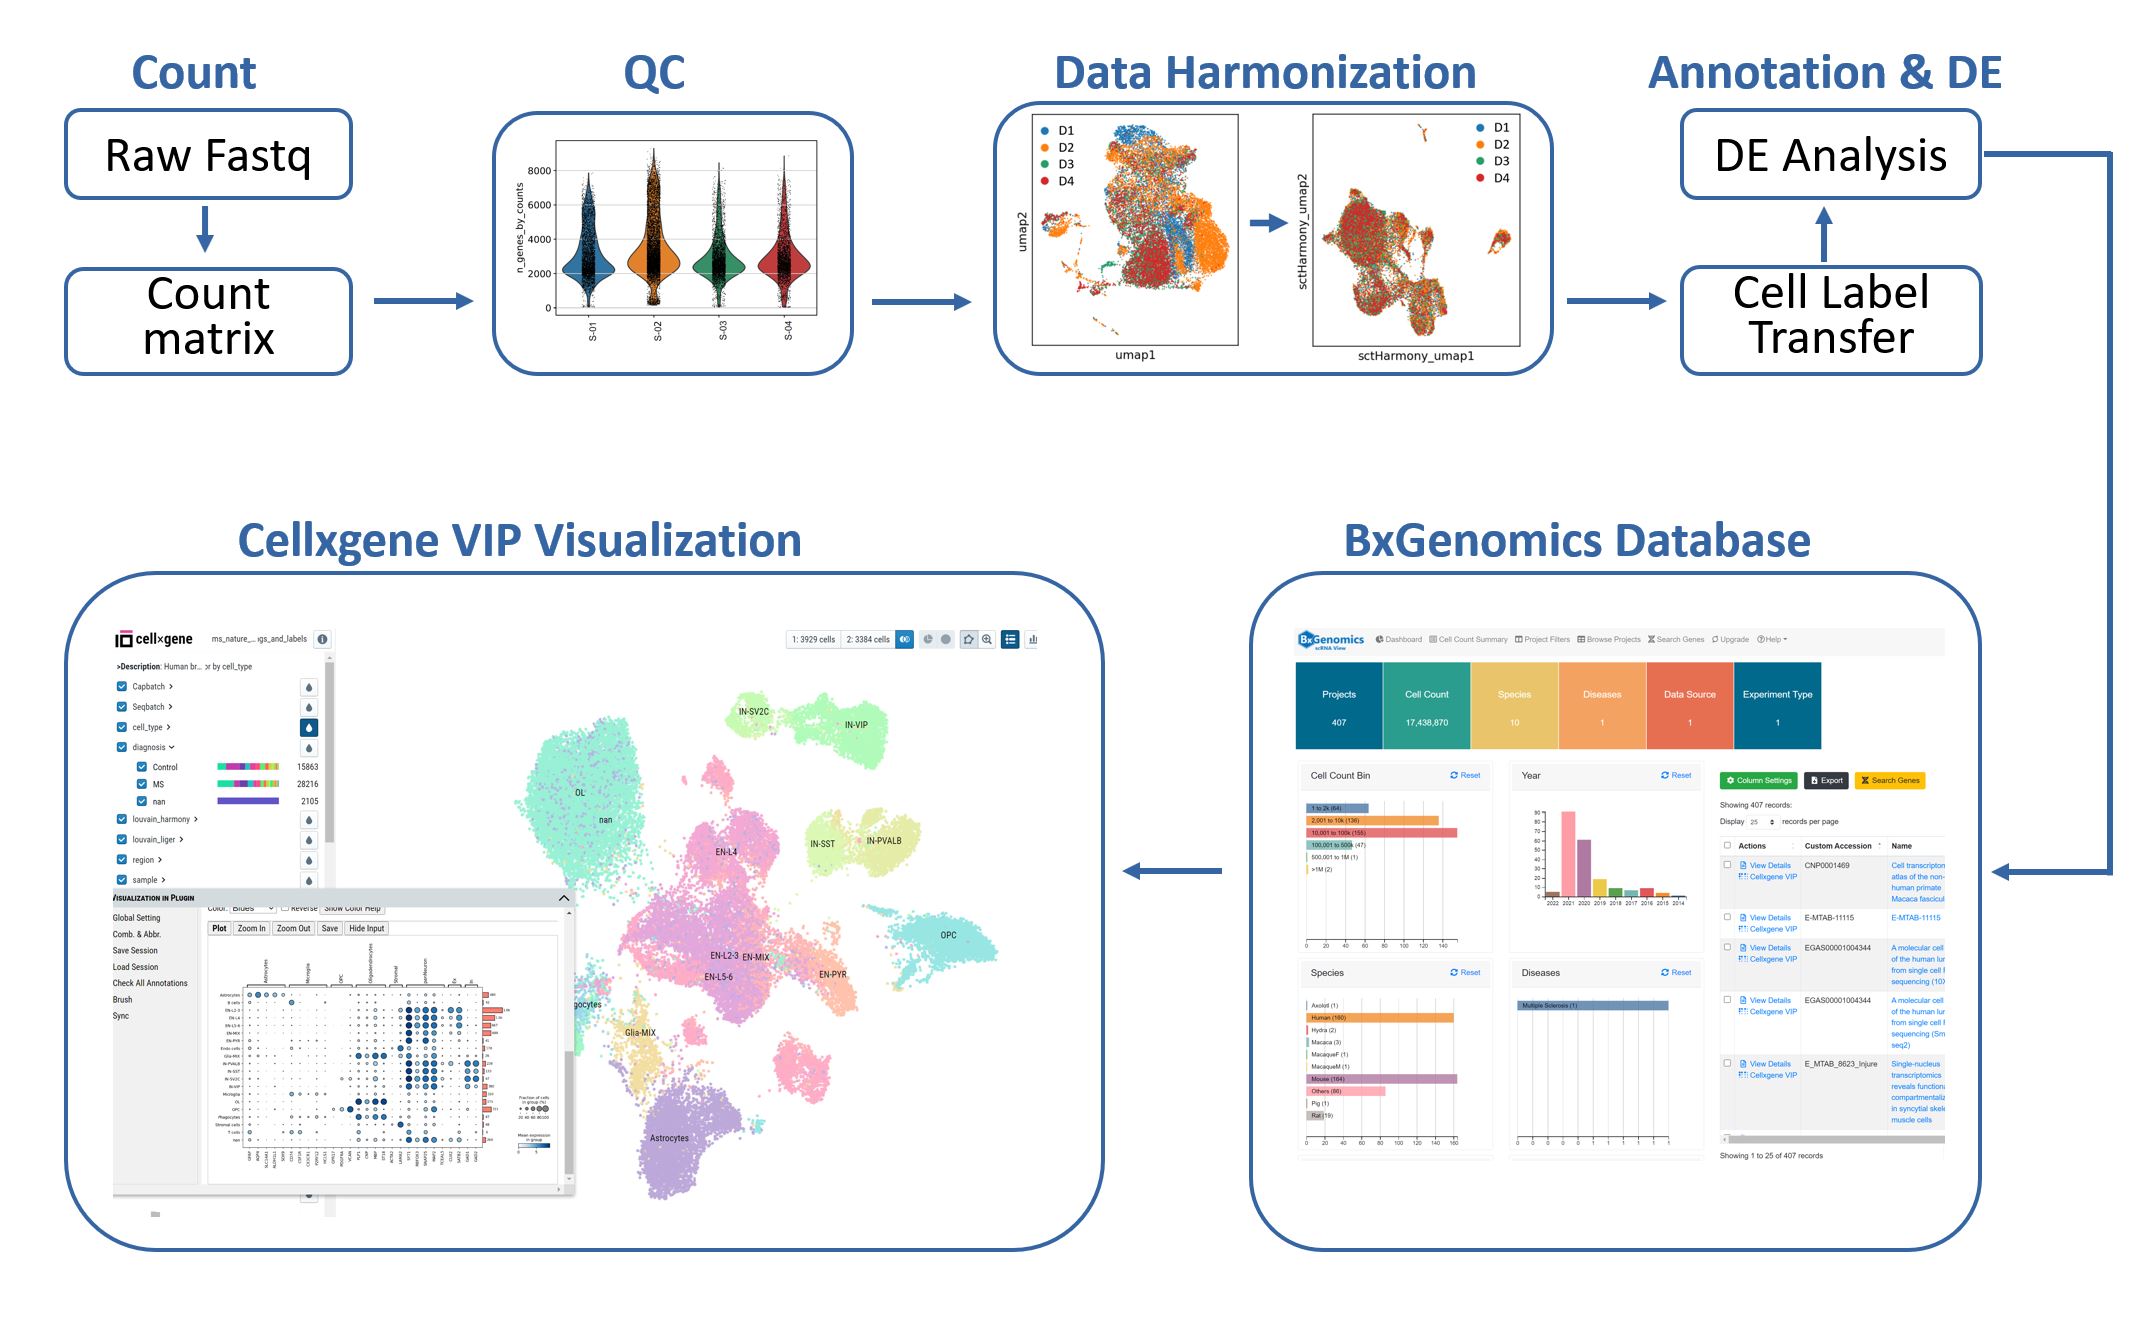
The workflow for single-cell RNA-Seq data analysis and visualization in BxGenomics.
The integrated BxGenomics web database includes single-cell RNA-Seq results from over 1,000 published datasets, as well as each user's private datasets. It provides an efficient data management system for single-cell datasets. Users can search the database using multiple attributes such as publication, keywords, species, and cell types. Advanced filters and tools for gene expression across datasets enable users to quickly find the datasets of interest and compare the expression of genes across them.
Importantly, each dataset can be loaded into the cellxgene VIP tool, which facilitates the rapid exploration of scRNA-Seq results in an interactive and scalable manner. This tool empowers researchers to gain insights into cell composition, gene expression profiles, and differentially expressed genes across cell types. By leveraging over 20 commonly used plotting functions and high-level analysis techniques in single-cell research, researchers can refine their analysis and deepen their understanding of the data.
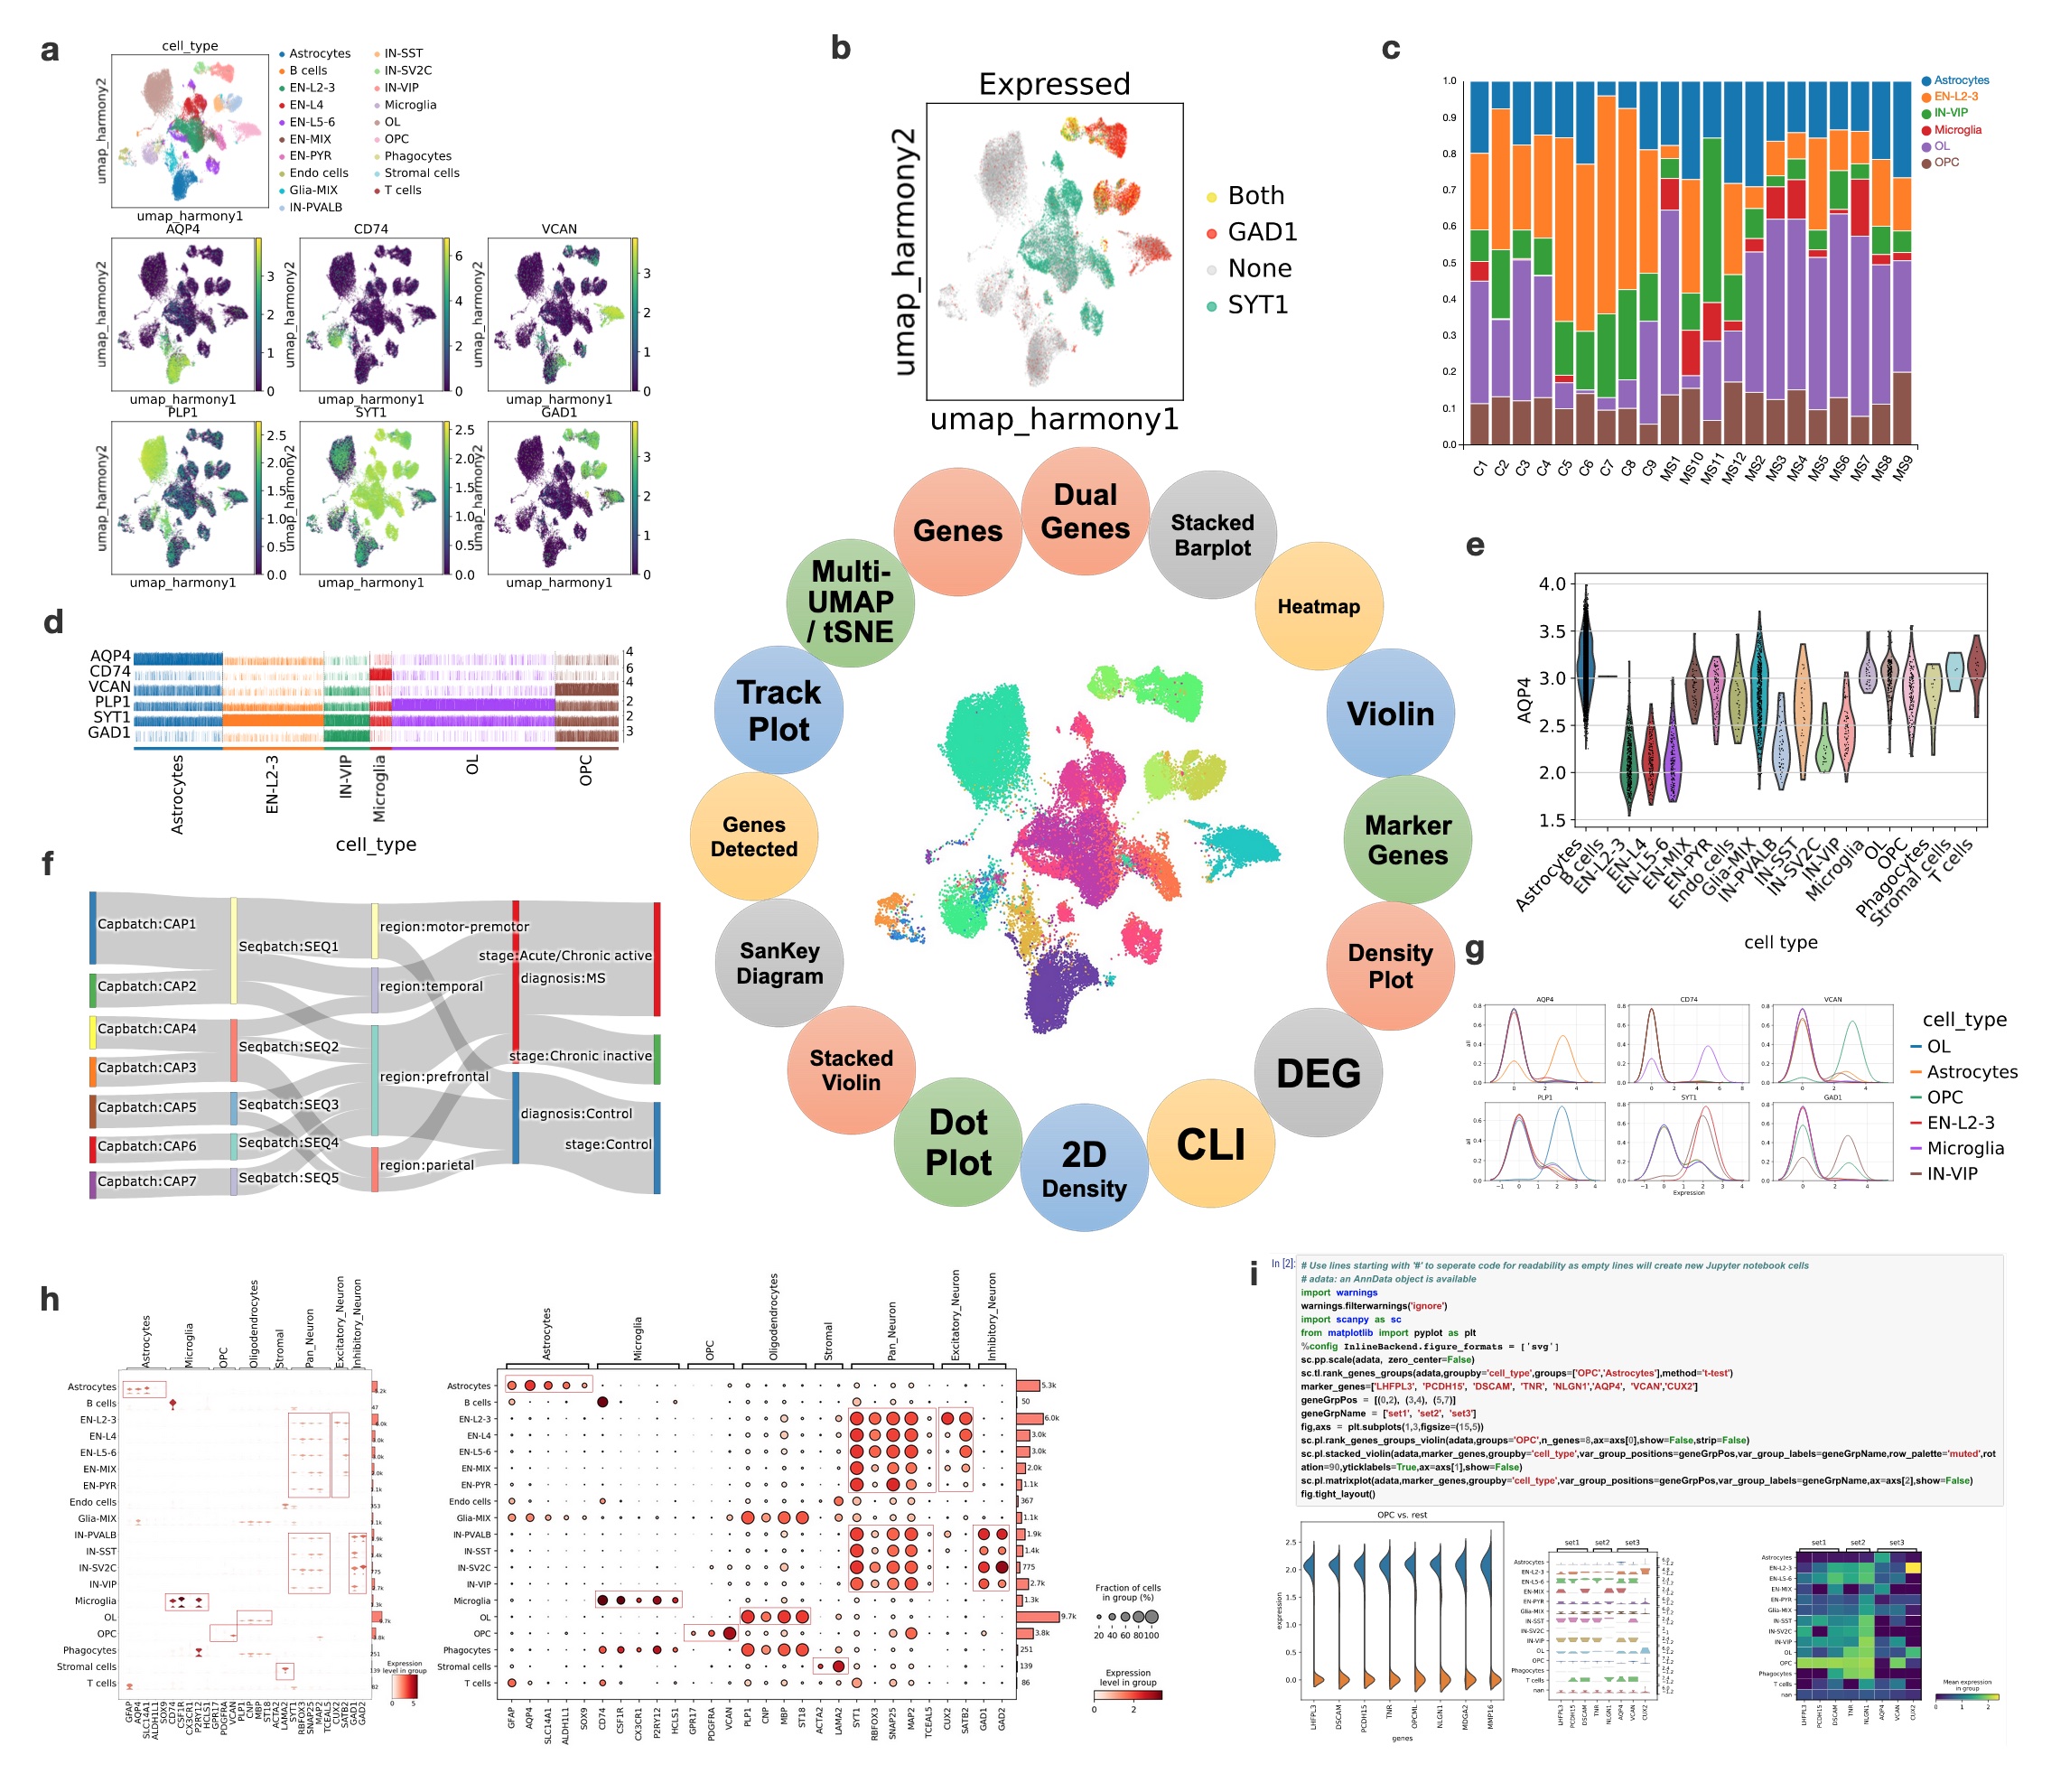
Unique to BxGenomics, scRNA-Seq results are visualized using the powerful cellxgene VIP system. Cellxgene VIP includes analytical modules that provide essential functions for interactive visualization and generation of publication-ready plots. These modules include: (a) Multi-tSNE/UMAP plots that visually highlight which cells express cell markers on selected embeddings (UMAP based on harmony batch correction in this example). (b) Dual-gene plots that highlight cells expressing SYT1 and GAD1 (green SYT1 only, red GAD1 only, yellow co-expression of STY1 and GAD1) with an expression cutoff of 2.2. (c) Stacked barplots that demonstrate the fraction of each major cell type across each sample (C represents Control and MS represents MS patients). (d) Trackplots that show the expression of lineage marker genes across individual cells in annotated clusters. (e) Violin plots that show the AQP4 gene expression across cell types. (f) Sankey diagrams (also known as Riverplots) that provide quick and easy ways to explore the interdependent relationship of variables in the MS snRNAseq datasets. (g) Density plots that show the expression of marker genes across annotated clusters and split across cell types. (h) Stacked violin and dot plots are the key visualizations of selected cell markers across cell types. They highlight the selective expressions, and validate the scRNA-Seq approaches and visualization methods. (i) Command Line Interface (CLI) exposed by mini Jupyter Notebook that provides maximal flexibility in doing various analyses overall or sliced single-cell datasets.
Bulk RNA-Seq Data Analysis and Mining for Everyone
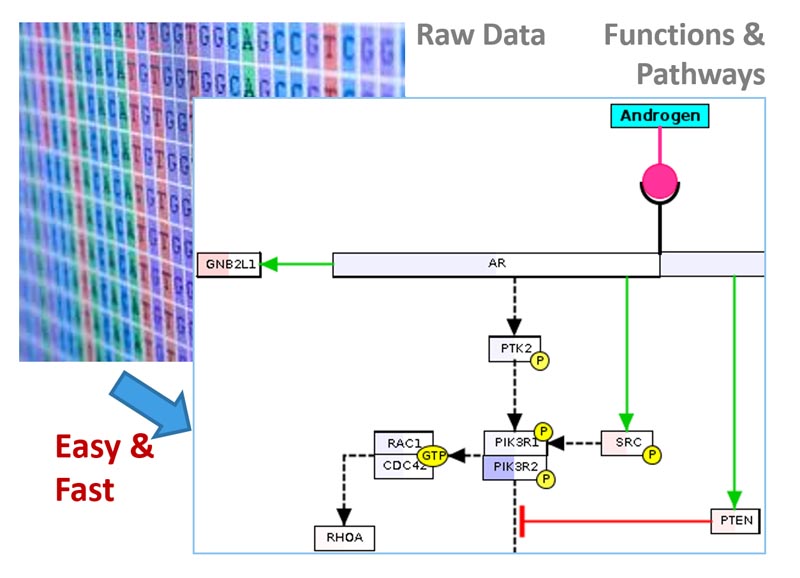
The Bulk RNA-Seq pipeline provides highly automated analysis of RNA-Seq data with robust statistical algorithms. The web-based data mining platform enables users to access gene expression results from anywhere and make continuous discoveries with intuitive data plotting and visualization tools.
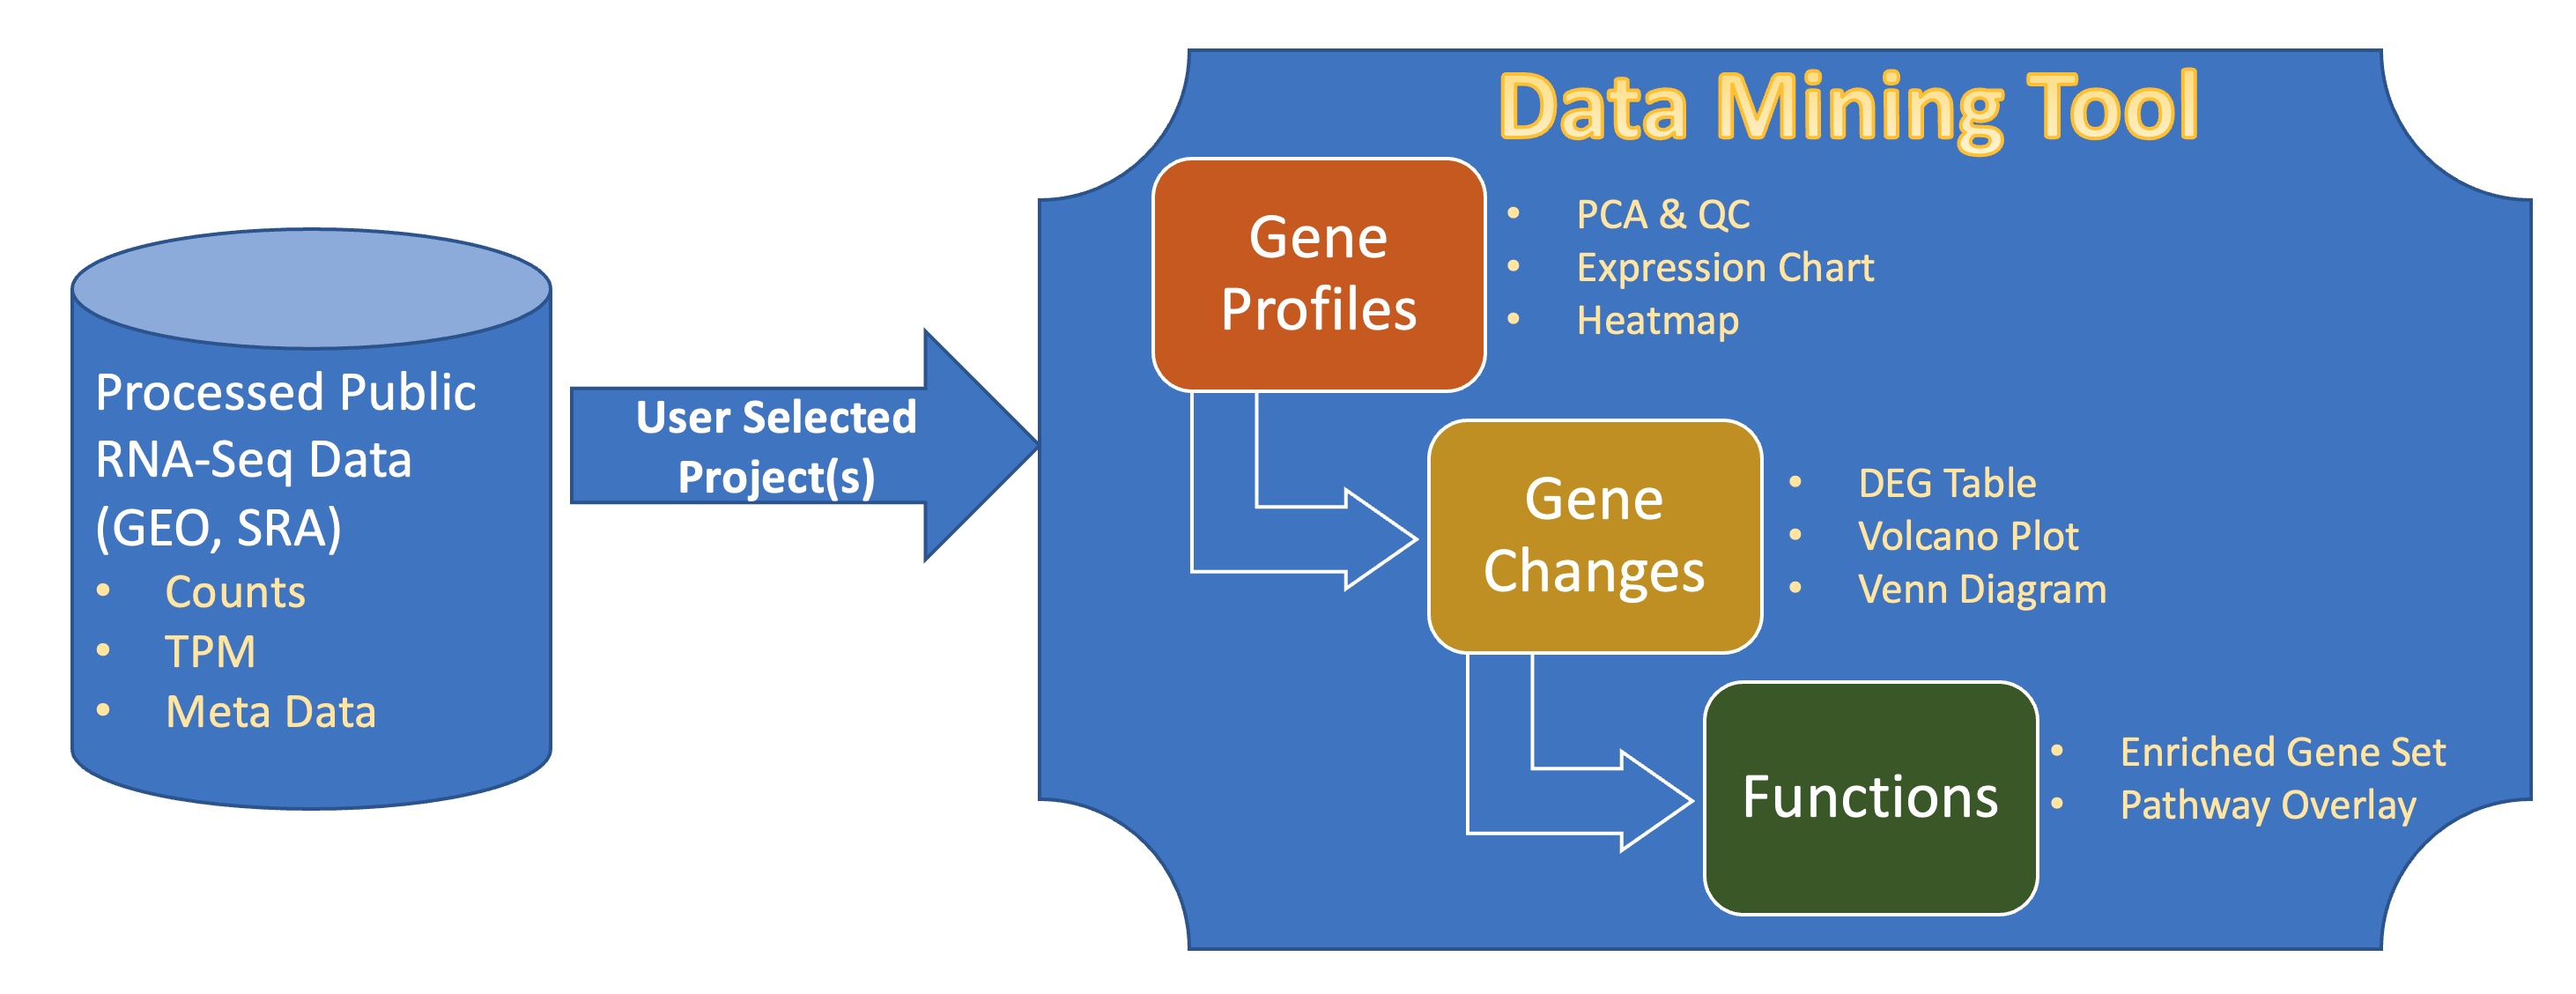
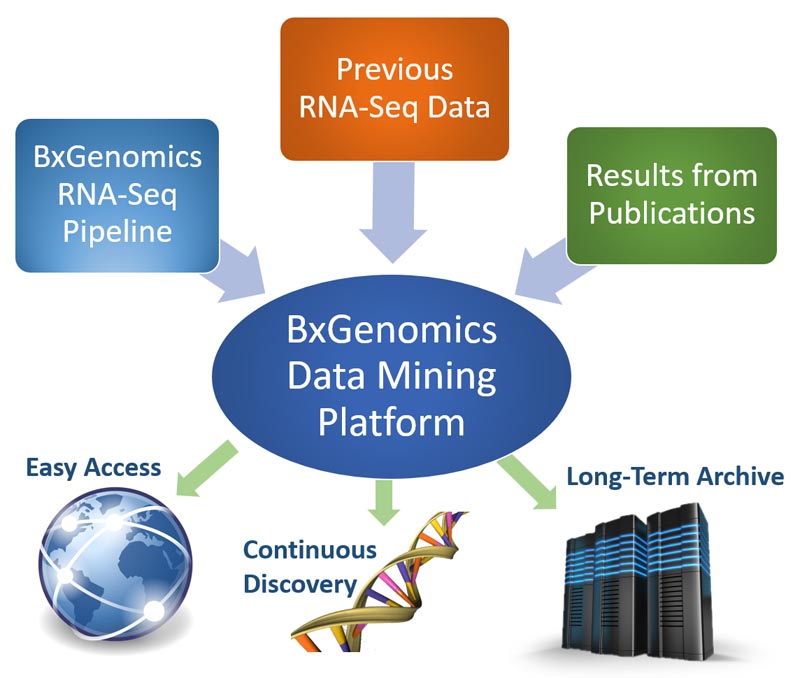
The diagram of bulk RNA-Seq repository and visualization in BxGenomics.
The methods used for BxGenomics bulk RNA-Seq analysis are well established, and our team has published the core elements of the system in peer-reviewed journals.
- Data analysis pipeline: RNASequest: An end-to-end reproducible RNAseq data analysis and publishing framework. Journal of Molecular Biology 2023
- Online portal for gene expression data: OmicsView: Omics data analysis through interactive visual analytics. Computational and Structural Biotechnology 2022
- Visualization platform: Quickomics: exploring omics data in an intuitive, interactive and informative manner. Bioinformatics 2021
About 700,000 human samples from over 12,000 projects in GEO and SRA are included in the BxGenomics Bulk RNA-Seq View platform. For each project, the sample meta data is extracted and can be used to annotate samples and specify conditions for comparisons. For each sample, gene count data is used to perform statistical analysis, and gene TMP data is used for visualization of gene expression.
BxGenomics Bulk RNA-Seq Case Studies:
BxGenomics system includes data processing capabilities to enable users to perform differentially expressed gene (DEG) analysis and pass along the results to the downstream data mining application QuickOmics.
Quickomics is a feature-rich R Shiny-powered tool that enables biologists to fully explore RNA-Seq results and perform advanced analysis in an easy-to-use interface. It covers a broad range of secondary and tertiary analytical tasks. Each functional module is equipped with customizable options and generates both interactive and publication-ready plots to uncover biological insights from data.
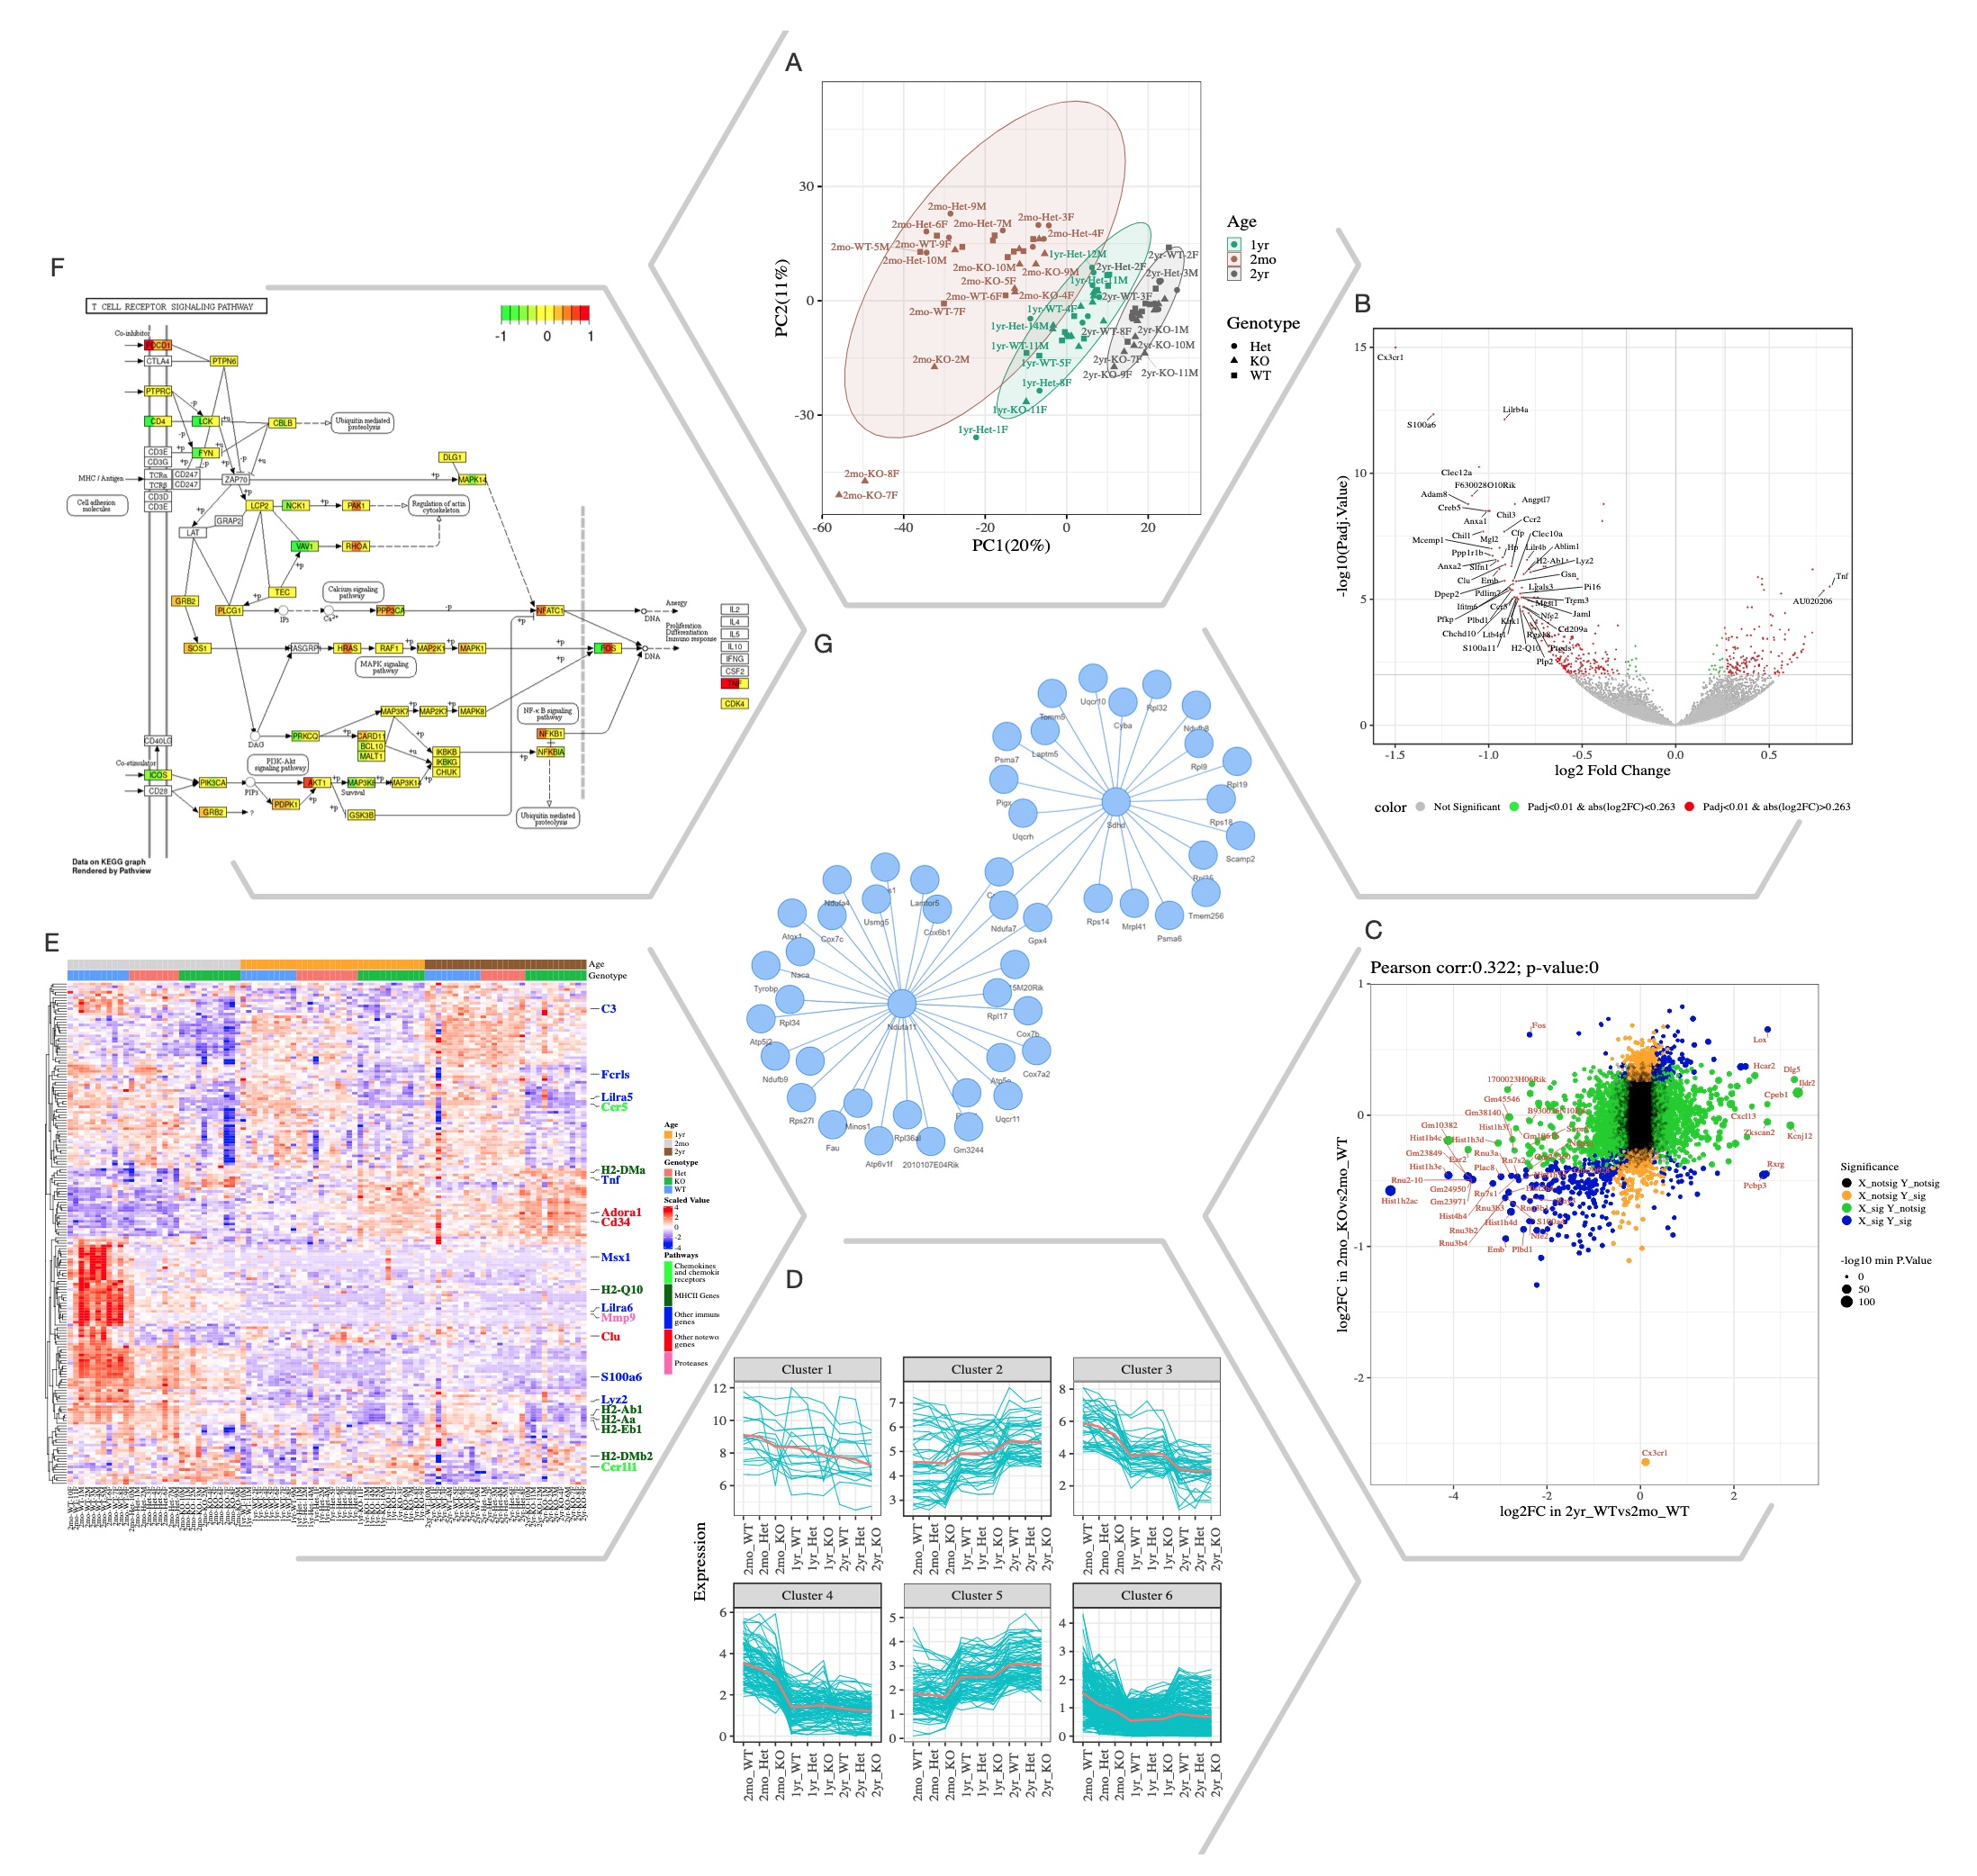
Selected Quickomics functions applied to a dataset of microglial RNA-Seq gene expression from three mouse genotypes over time. (A) PCA based on the full datasets highlights primary sample separation by mouse age at which the cells were isolated. (B) Volcano plot visualizes differentially expressed genes, most of which show reduced expression in 2mo KO compared to 2mo_WT microglia. For the spacing purpose, absolute log2FC (Fold Change) and negative log10 adjusted p-value are capped at 1.5 and 15, respectively. (C) Correlation analysis between the two comparisons shows that aging and Cx3cr1-KO have a similar effect on gene expression. (D) Pattern clustering identifies subsets of genes with similar expressions among the samples. The clustering is mostly driven by age, with the KO genotype having a similar, but smaller effect. (E) Heatmap of all samples allows the identification of gene clusters with expression regulated by age and/or genotype. Key genes and the pathways they belong to are highlighted on the right. (F) After pathway enrichment analysis, KEGG pathways (Kanehisa and Goto, 2000) of interest can be displayed in a cellular context. The color bars within each gene stripe represent the log2 fold changes in three comparisons, allowing project-wide insights for patterns of expression. (G) Correlation network shows potential links between genes of interest.
FAQ
- 1. What can you do with Bulk RNA View?
-
Bulk RNA View contains the most up-to-date collection of the human public bulk RNA-Seq data sets from the GEO database.
It also contains the pipeline to process the datasets and easy-to-use tools to display the results in plots and tables, including sample relationship (PCA plot, heatmap), gene expression, DEG, and enriched pathways. The interactive plots can be easily customized to meet the publication requirement according to the user’s preference.
- 2. Who should use Bulk RNA View?
-
Anyone who has basic knowledge of and is interested in the bulk RNA-seq data analysis. No coding experience is required.
- 3. How to get started with Bulk RNA View?
-
Click on the button Start Bulk RNA-Seq View, you will see a table listing all the available data sets. Find your interested data set first.
Check for the last Actions column, there are two links: Quick View and DEG Analysis.
To view the expression data, please click on Quick View. You will enter the result display page. Try to select different sections in the top menu. Each section has several tabs for different tools. Help locates in the last tab containing the explanation of all the tools in every section.
To find the DEG and enriched pathways, please click on the DEG Analysis link in the last Actions column, and you will see the analysis setup page. The page shows the sample meta table, which can be used to create comparisons of interest at the bottom of the page. If you want to make comparisons whose grouping information does not exist in the sample meta table, you can check the Edit the sample information link on the top of the page and follow the instructions to update the sample meta table. After you fill in all the comparison information, click on the Start Analysis button. After a few moments, you will see a very similar page as you can see in the Quick View. But on this page, you will see 3 more sections: DEG, Gene Set Enrichment, and Venn Diagram. These are the tools used to explore the comparison values.
Analyze Your Own Data
BxGenomics enables biologists to easily analyze bulk and single-cell RNA-Seq data, identify differentially expressed genes and enriched pathways, and further visualize the results and compare findings across projects using interactive data mining tools.
Why Use BxGenomics and Related Services?

Biologically Meaningful Answers
Immediately find altered genes and functional pathways in instant reports.

Full Potential of Data
Explore your results in an interactive online database to delve into details.

Expert Bioinformatics Support
Rest assured that your data are in good hands and help is always available.
Data Analysis Service Overview
| Type of Analysis | Bulk RNA-Seq | scRNA-Seq |
|---|---|---|
| Input | Raw fastq files or gene count and gene TPM files | Count matrix file, or raw fastq files |
| Gene Level Analysis | QC (PCA, covariates); gene expression plot, clustering and correlation; heatmap with functional gene sets. | Multi-UMAP/tSNE; violin and dot plot for genes of interest; stacked barplot for cell types; Sankey diagram for variable relationship. |
| Advanced Analysis | Differential gene expression between conditions; Venn diagram of comparisons; functional enrichment and pathway overlay. | Identify marker genes; assign cell types based on reference data; gene set enrichment. |
| Visualization Tool | QuickOmics | Cellxgene VIP |
RNA-Seq Analysis service is easy to use. Just provide raw data and the sample description, and a professional report and personalized online database will be delivered to you in 1-2 weeks.
An expert-designed analysis pipeline will work for you behind the scenes, including comprehensive QC of raw data and gene counts, robust statistical analysis for differentially expressed genes, advanced functional pathway analysis, and more. All results are reviewed by experts before final delivery.
Once the RNA-Seq data is uploaded to the BxGenomics data mining platform, authorized users can access the data with a browser anytime from anywhere with an internet connection.
Different kinds of gene IDs are automatically recognized and converted so gene expression data are easily integrated between different projects analyzed with different types of gene IDs.
The BxGenomics platform serves dual purposes, as a data mining system of all RNA-Seq results in the laboratory to enable continuous discovery, and as a data archive system to enable data longevity and long-term access.
The BxGenomics RNA-Seq service team consists of highly educated scientists and customer support managers with decades of experience in biological studies and genomics.
The team works collaboratively with customers to provide the utmost service for the success of every RNA-Seq project. Customers benefit from continuous high-quality technical support by a friendly and responsive team.
Methods and References
Methods
Single-cell RNA-Seq Analysis
- Count Matrix from 10X raw data: Cellranger
- Data analysis: Seurat, Scanpy, Harmony, LIGER
- Single-Cell RNA analysis framework: scRNASequest
- Interactive scRNA data visualization: Cellxgene VIP
- Single-cell RNA-Seq database: CellDepot
Bulk RNA-Seq Analysis
- Generate gene count, one of the methods will be used based on the project.
- Subread + Featurecount
- STAR + RSEM
- Kallisto or Salmon
- Differential gene expression: limma or DESeq2
- Bulk RNA-Seq analysis framework: RNASequest
- Online database and visualization for expression data: OmicsView
- Advanced Shiny-based data visualization: QuickOmics
References
- Liao Y, Duan B, Zhang Y, Zhang X, Xia B. Excessive ER-phagy mediated by the autophagy receptor FAM134B results in ER stress, the unfolded protein response, and cell death in HeLa cells. J Biol Chem. 2019 Dec 27;294(52):20009-20023. doi: 10.1074/jbc.RA119.008709. Epub 2019 Nov 20. PMID: 31748416, PMCID: PMC6937584
- Kong G, You X, Wen Z, Chang YI, Qian S, Ranheim EA, Letson C, Zhang X, Zhou Y, Liu Y, Rajagopalan A, Zhang J, Stieglitz E, Loh M, Hofmann I, Yang D, Zhong X, Padron E, Zhou L, Pear WS, Zhang J. Downregulating Notch counteracts Kras(G12D)-induced ERK activation and oxidative phosphorylation in myeloproliferative neoplasm. Leukemia. 2019 Mar;33(3):671-685. doi: 10.1038/s41375-018-0248-0. Epub 2018 Sep 11. PMID: 30206308, PMCID: PMC6405304
- Zhang J, Kong G, Rajagopalan A, Lu L, Song J, Hussaini M, Zhang X, Ranheim EA, Liu Y, Wang J, Gao X, Chang YI, Johnson KD, Zhou Y, Yang D, Bhatnagar B, Lucas DM, Bresnick EH, Zhong X, Padron E, Zhang J. p53-/- synergizes with enhanced NrasG12D signaling to transform megakaryocyte-erythroid progenitors in acute myeloid leukemia. Blood. 2017 Jan 19;129(3):358-370. doi: 10.1182/blood-2016-06-719237. Epub 2016 Nov 4. PMID: 27815262, PMCID: PMC5248933
- Suter B, Zhang X, Pesce CG, Mendelsohn AR, Dinesh-Kumar SP, Mao JH. Next-Generation Sequencing for Binary Protein-Protein Interactions. Front Genet. 2015 Dec 17;6:346. doi: 10.3389/fgene.2015.00346. eCollection 2015. PubMed [citation] PMID: 26734059, PMCID: PMC4681833
- Combined MEK and JAK inhibition abrogates murine myeloproliferative neoplasm. Kong G, Wunderlich M, Yang D, Ranheim EA, Young KH, Wang J, Chang YI, Du J, Liu Y, Tey SR, Zhang X, Juckett M, Mattison R, Damnernsawad A, Zhang J, Mulloy JC, Zhang J. The Journal of Clinical Investigation. 2014 May 8; 124(6): 2762-2773 PMC [article] PMCID: PMC4038579, PMID: 24812670, DOI: 10.1172/JCI74182
- Still AJ, Floyd BJ, Hebert AS, Bingman CA, Carson JJ, Gunderson DR, Dolan BK, Grimsrud PA, Dittenhafer-Reed KE, Stapleton DS, Keller MP, Westphall MS, Denu JM, Attie AD, Coon JJ, Pagliarini DJ. Quantification of mitochondrial acetylation dynamics highlights prominent sites of metabolic regulation. J Biol Chem. 2013 Sep 6;288(36):26209-19. doi: 10.1074/jbc.M113.483396. Epub 2013 Jul 17. PubMed [citation] PMID: 23864654, PMCID: PMC3764825
- Wang J, Kong G, Liu Y, Du J, Chang YI, Tey SR, Zhang X, Ranheim EA, Saba-El-Leil MK, Meloche S, Damnernsawad A, Zhang J, Zhang J. Nras(G12D/+) promotes leukemogenesis by aberrantly regulating hematopoietic stem cell functions. Blood. 2013 Jun 27;121(26):5203-7. doi: 10.1182/blood-2012-12-475863. Epub 2013 May 17. PMID: 23687087, PMCID: PMC3695364
- Grimsrud PA, Carson JJ, Hebert AS, Hubler SL, Niemi NM, Bailey DJ, Jochem A, Stapleton DS, Keller MP, Westphall MS, Yandell BS, Attie AD, Coon JJ, Pagliarini DJ. A quantitative map of the liver mitochondrial phosphoproteome reveals posttranslational control of ketogenesis. Cell Metab. 2012 Nov 7;16(5):672-83. doi: 10.1016/j.cmet.2012.10.004. PMID: 23140645, PMCID: PMC3506251
- Mougeot JL, Li Z, Price AE, Wright FA, Brooks BR. Microarray analysis of peripheral blood lymphocytes from ALS patients and the SAFE detection of the KEGG ALS pathway. BMC Med Genomics. 2011 Oct 25;4:74. doi: 10.1186/1755-8794-4-74. PMID: 22027401, PMCID: PMC3219589
- Galliher-Beckley AJ, Williams JG, Cidlowski JA. Ligand-independent phosphorylation of the glucocorticoid receptor integrates cellular stress pathways with nuclear receptor signaling. Mol Cell Biol. 2011 Dec;31(23):4663-75. doi: 10.1128/MCB.05866-11. Epub 2011 Sep 19. PMID: 21930780, PMCID: PMC3232926
- Al-Dhaheri M, Wu J, Skliris GP, Li J, Higashimato K, Wang Y, White KP, Lambert P, Zhu Y, Murphy L, Xu W. CARM1 is an important determinant of ERα-dependent breast cancer cell differentiation and proliferation in breast cancer cells. Cancer Res. 2011 Mar 15;71(6):2118-28. doi: 10.1158/0008-5472.CAN-10-2426. Epub 2011 Jan 31. PMID: 21282336, PMCID: PMC3076802
- Grimsrud PA, den Os D, Wenger CD, Swaney DL, Schwartz D, Sussman MR, Ané JM, Coon JJ. Large-scale phosphoprotein analysis in Medicago truncatula roots provides insight into in vivo kinase activity in legumes. Plant Physiol. 2010 Jan;152(1):19-28. doi: 10.1104/pp.109.149625. Epub 2009 Nov 18. PMID: 19923235, PMCID: PMC2799343
- Zhu Y, Davis S, Stephens R, Meltzer PS, Chen Y. GEOmetadb: powerful alternative search engine for the Gene Expression Omnibus. Bioinformatics. 2008 Dec 1;24(23):2798-800. doi: 10.1093/bioinformatics/btn520. Epub 2008 Oct 7. PubMed [citation] PMID: 18842599, PMCID: PMC2639278
- Keller MP, Choi Y, Wang P, Davis DB, Rabaglia ME, Oler AT, Stapleton DS, Argmann C, Schueler KL, Edwards S, Steinberg HA, Chaibub Neto E, Kleinhanz R, Turner S, Hellerstein MK, Schadt EE, Yandell BS, Kendziorski C, Attie AD. A gene expression network model of type 2 diabetes links cell cycle regulation in islets with diabetes susceptibility. Genome Res. 2008 May;18(5):706-16. doi: 10.1101/gr.074914.107. Epub 2008 Mar 17. PMID: 18347327, PMCID: PMC2336811
- Zhu Y, Zhu Y, Xu W. EzArray: a web-based highly automated Affymetrix expression array data management and analysis system. BMC Bioinformatics. 2008 Jan 24;9:46. doi: 10.1186/1471-2105-9-46. PMID: 18218103, PMCID: PMC2265266
Bulk RNA View Demo Videos
- Database Introduction
- DEG Analysis Introduction
- Heatmap and Expression Plots
- GSEA and KEGG Plots
- Sample Metadata Editing